New releases
This page shows the latest features released or coming soon in PowerDIS, as well as the release notes.
December 2021
This update adds the following new features:
Sharing projects between users
Merging of the project initialization and study setup pages
Adding graphs in the consumption results page
Customized exports
Ergonomic improvements
Project sharing
You can now share a project with other users who have a PowerDIS account. When you have an active project, sharing is done using the « Share » button located above the study tile. In the modal, you can enter the email address of the contact you want to give access to the project. Once you have added a new member to the project, you can edit the rights of the members and remove a member from the project by clicking on « Manage members » at the bottom right of the modal. The rights are only editable by the project owner. Each project must have at least one owner.
Rights |
Owner |
Member |
|---|---|---|
Project sharing |
Yes |
Yes |
Member management |
Yes |
No |
Project editing |
Yes |
Yes |
Project duplication |
Yes |
Yes |
Delete projects |
Yes |
No |
Study editing |
Yes |
Yes |
Study duplication |
Yes |
Yes |
Delete studies |
Yes |
No |
Two users cannot access the same study simultaneously. Duplicating a project duplicates all of its contents, and retains the sharing rights with the users concerned.
It is also possible to associate scenario files and weather files from multiple users to a project via the project libraries accessible from the dashboard, above the studies” tiles. The shared files are then accessible directly in the studies when setting up a study.
Shared files cannot be exported by other users and remain linked to their owners. The deletion of a member of a project therefore leads to the dissociation of his files from the project. When files are disassociated from a project, the results associated with these files are deleted, and the studies concerned are modified as follows:
The dissociated weather file is replaced by the weather file closest to the project location
The disassociated scenarios are removed from the areas in which they were assigned.

Sharing options on the dashboard
Merge of initialization and study pages
Creating a new project always brings the user to the initialization page, where it is possible to draw or import new buildings. Buildings can now be initialized directly on this same page, and their envelope characteristics and usage scenarios can be defined after initialization.
It is thus possible to add new buildings or modify the properties of existing buildings without having to create a new project.
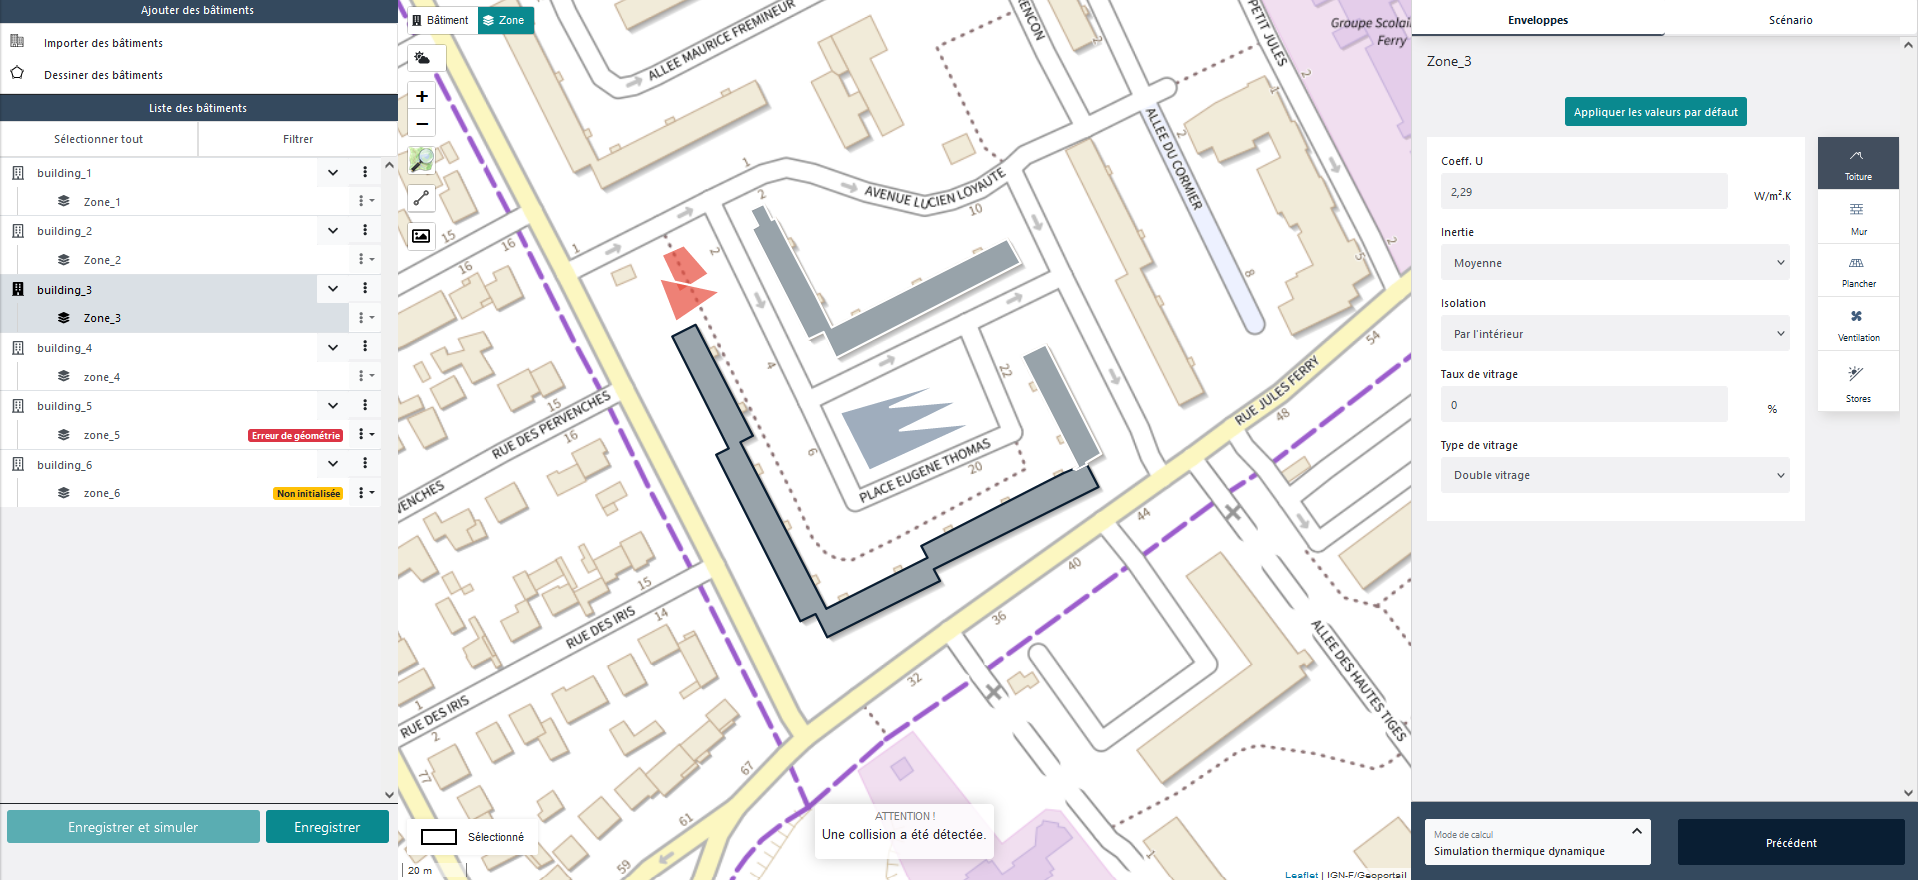
View of the merge of the initialization and study page
Additional graphs in the consumption results
Graphs are now available to represent the annual and hourly performance of the project’s energy systems.
The « Annual Indicators » tab shows the following results for the user’s system selection:
Consumption by energy carrier;
Delivered energy by energy carrier;
Performance (COP and yields);
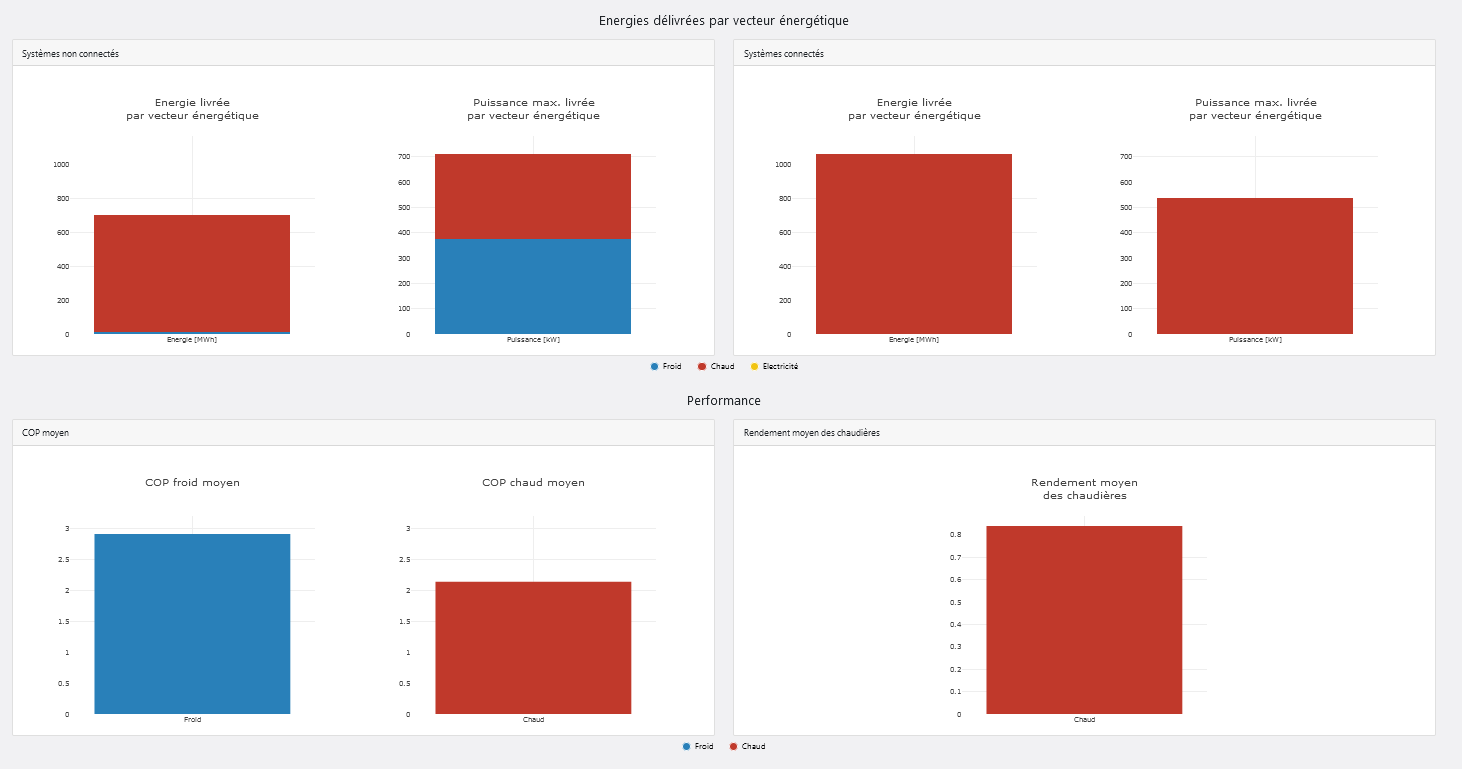
New yearly KPIs at the energy system scale
The « Hourly Analysis » tab now contains system-specific results:
Power input by energy carrier;
Power delivered by energy carrier;
Heat pump COP;
Boiler efficiency;
Temperatures at the system inlet and outlet.
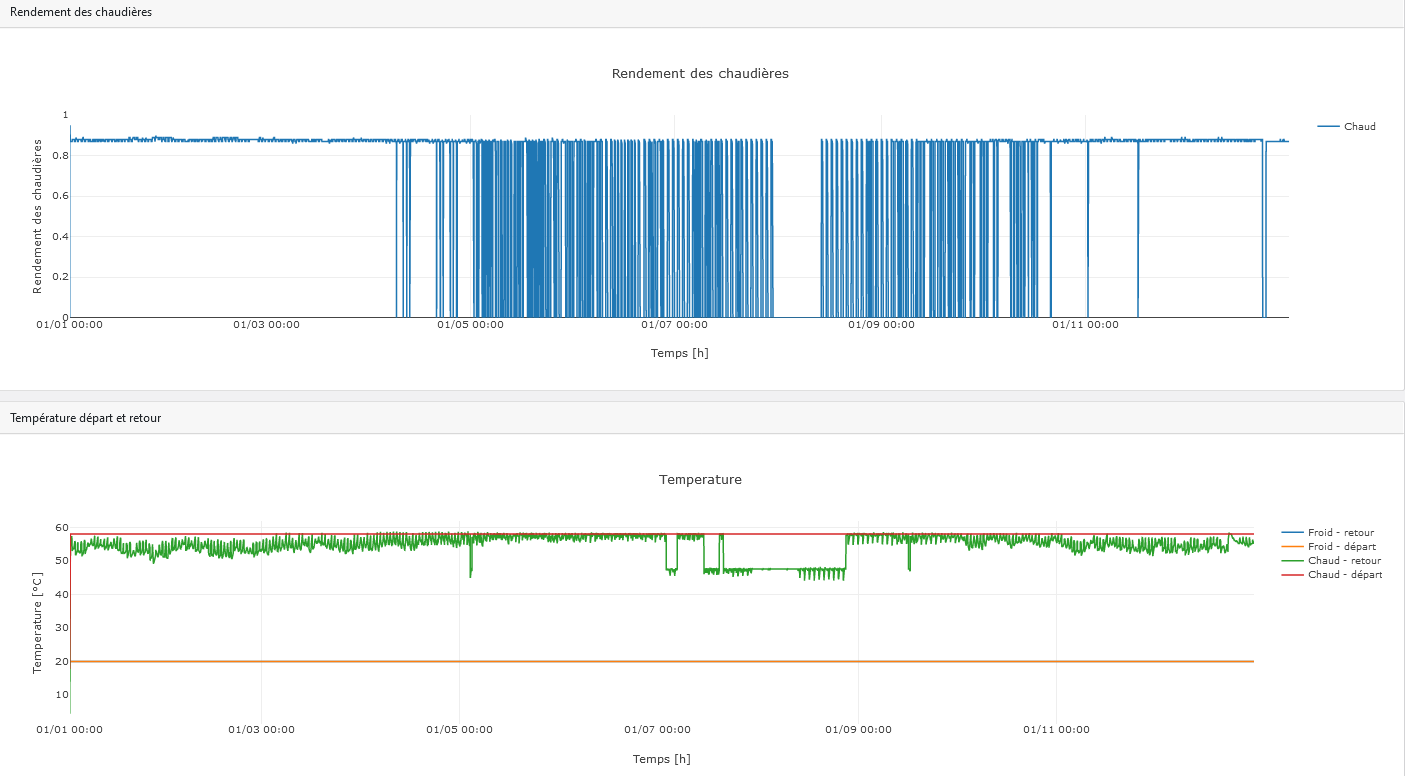
New hourly results at the energy system scale.
A visualization of the hourly dynamics of the energy produced at each boiler room has also been added. All these new results are included in the export files.
Custom Exports
The new update contains a complete redesign of the export files. It is also possible to export only a part of the results.
Export of bluiding loads results: It is still possible to export building loads results in .xlsx or .csv format, but the following options are now also available in the export modal:
Results for a selection of zones or for all zones;
Results at hourly intervals;
Results at monthly intervals
Annual results;
Zone settings;
Export of a GeoJSON file containing the results and directly usable in a GIS software.
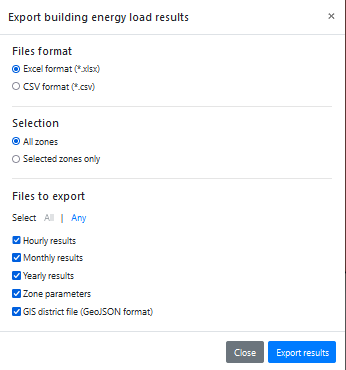
New building loads results export modal.
Export of consumption results:
It is still possible to export consumption results in .xlsx or .csv format, but the following options are now also available in the export modal:
Results for a selection of systems or for all systems;
Results for systems and a GeoJSON file containing the results for each zone, directly usable in a GIS software;
Results at the network level and a GeoJSON file containing all the characteristics of the network, directly usable in a GIS software;
Results of the boiler rooms;
Zone settings.
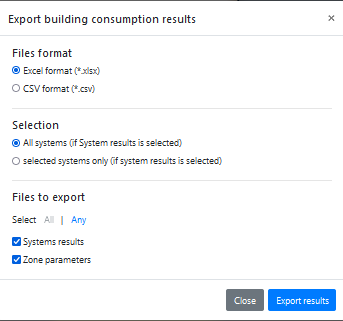
New consumptions results export modal.
Ergonomic improvements
In addition to the features described above, many improvements have been applied to the different pages of the interface.
Dashboard :
Corrected responsiveness bug that made the buttons disappear for some browser zoom levels
Building modeling page:
It is now possible to delete a building directly, and not only to delete its zones
The weather file is now filled in via a button on the top left of the map (the closest file is used by default)
It is now possible to assign all default scenarios to all buildings in two clicks
Results page needs :
Simplification of the display of values on the graphs when the mouse passes over them
Improvement of the response of the graphs after changing the selection
Export of zone settings also includes wall and roof surfaces.
Systems and networks entry page:
Zone services provided by systems are now colored in the left menu
Added explanatory elements in the legend
Added information in the tooltips displayed on the buildings
Consumption results page :
The selection of the elements of the left list is now done by systems, at building level or at zone level
Improvement of the graphs visualization (legend, values at mouse over)
Improvement of the response of the graphs after changing the selection