PowerDIS tutorial
Acessing PowerDIS
You can access the PowerDIS web interface through the following link: https://powerdis.efficacity.com
The PowerDIS login page allows you to access your personal space, containing your projects. The identifiers and passwords are sent to you by e-mail on request (you need to fill in the form in the login page).
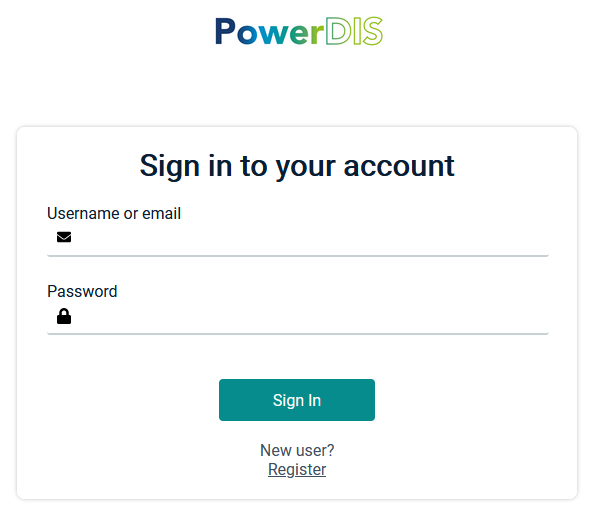
PowerDIS login page
PowerDIS dashboard
The PowerDIS home page (Dashboard) allows you to manage your projects (left column) and your studies (right column).

The PowerDIS dashboard
Each project or study has a toolbar that allows you to perform different actions (from left to right):
Access the project / study
Edit name and description
Duplicate the project / study
Delete the project / study

Project / study management toolbar
Creating a project
You can create a project by clicking on the button Create a project at the top of the projects list.

Button for project creation
You must then give the project a title and a description, then search for and select an address, which allows the map to be centered when the project is opened for the first time.
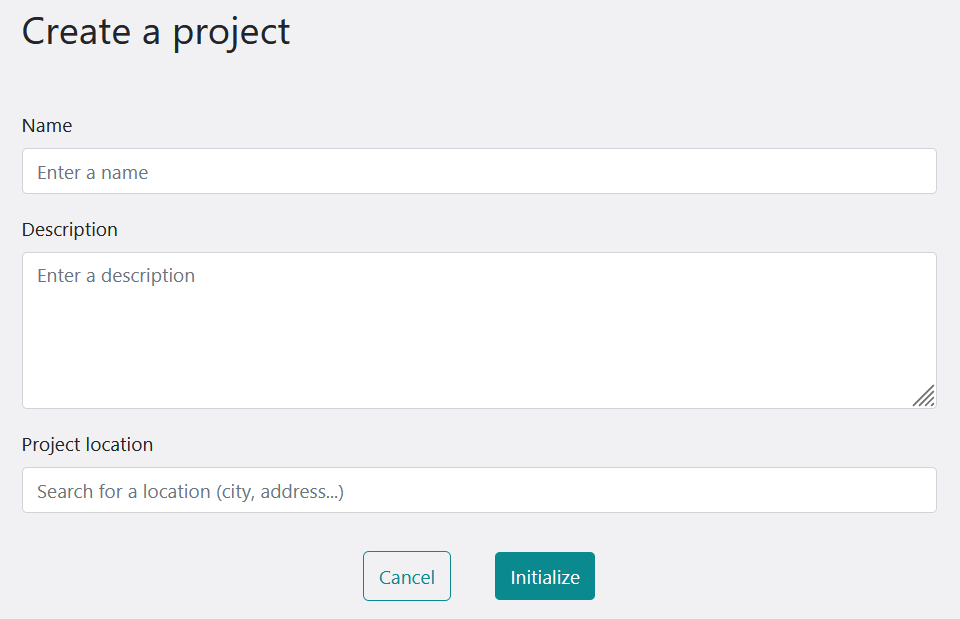
Project creation page
Clicking on Initialize brings you to the study page.
Creating a study
You must then create a first study for your project by entering a name and a description. Note that additional studies can be created by clicking the « Create a study » button at the top of the right-hand side column on the dashboard.
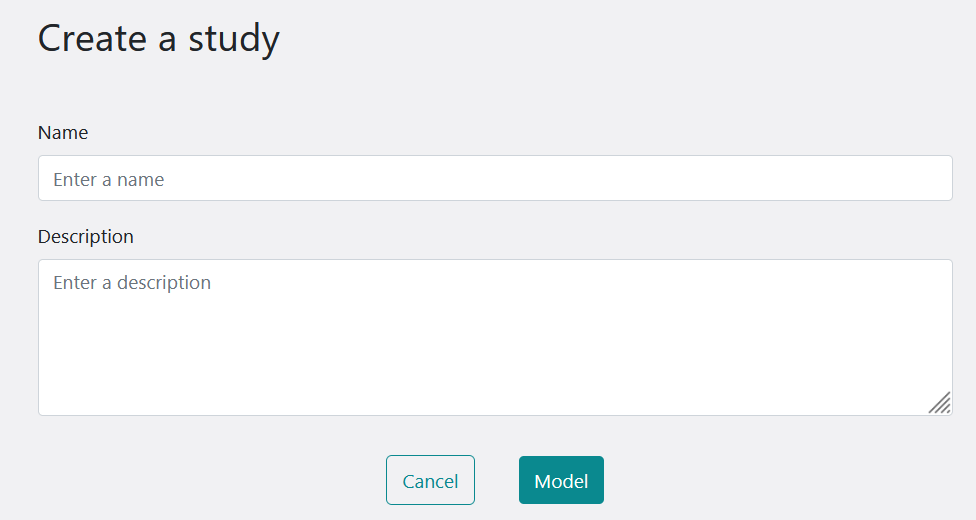
Study creation page
From this step, the study can be duplicated or deleted in the dashboard. To edit the settings of the buildings in the sudy from the dashboard, click on the eye icon on the study tile.
A study consists of four consecutive steps which are described below:
Modeling buildings
Building loads results
Modeling systems and thermal network
Systems consumptions results
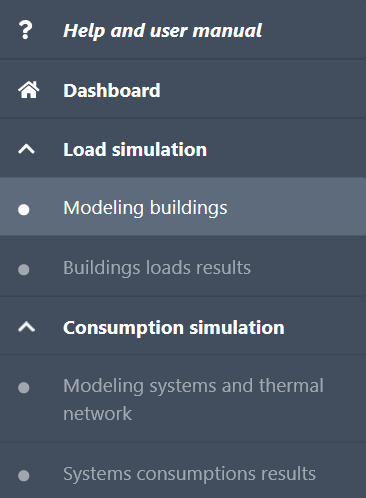
Steps to create a study
Import existing buildings from the BD TOPO®
Note: The import functionality from the BD TOPO® is only available for addresses in France (metropolitan and overseas). For an international project, please refer directly to the following section Entering buildings manually
Your project starts at the address you specified in the previous step. To begin, you can import buildings from the base map by clicking on the import button at the top of the left-hand menu.

Button for importing buildings
By clicking on the button, the mouse cursor allows to draw a perimeter in which all the buildings present in the BD TOPO® are imported and their properties available in the database are automatically filled in.
Once the polygon is drawn, click on Import in the button menu to trigger the import of the buildings and their characteristics. Click Cancel to cancel a current perimeter drawing if necessary.
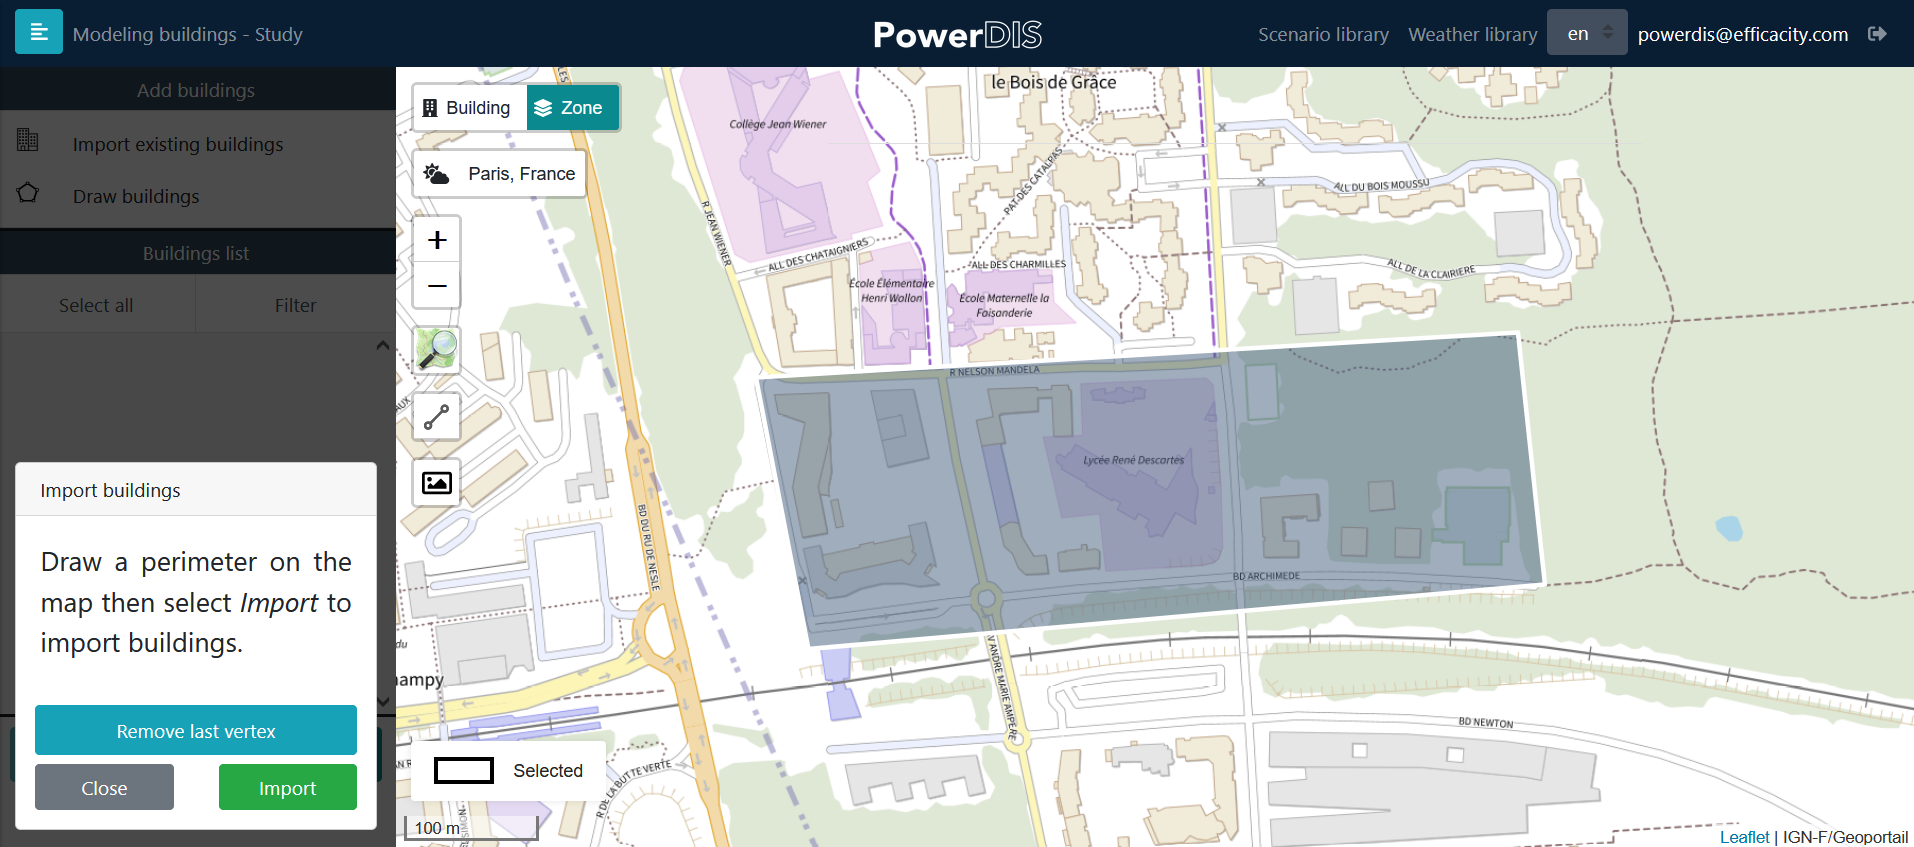
Drawing an import perimeter
The footprints of the imported buildings are visible on the map and the buildings are clickable to edit their characteristics.
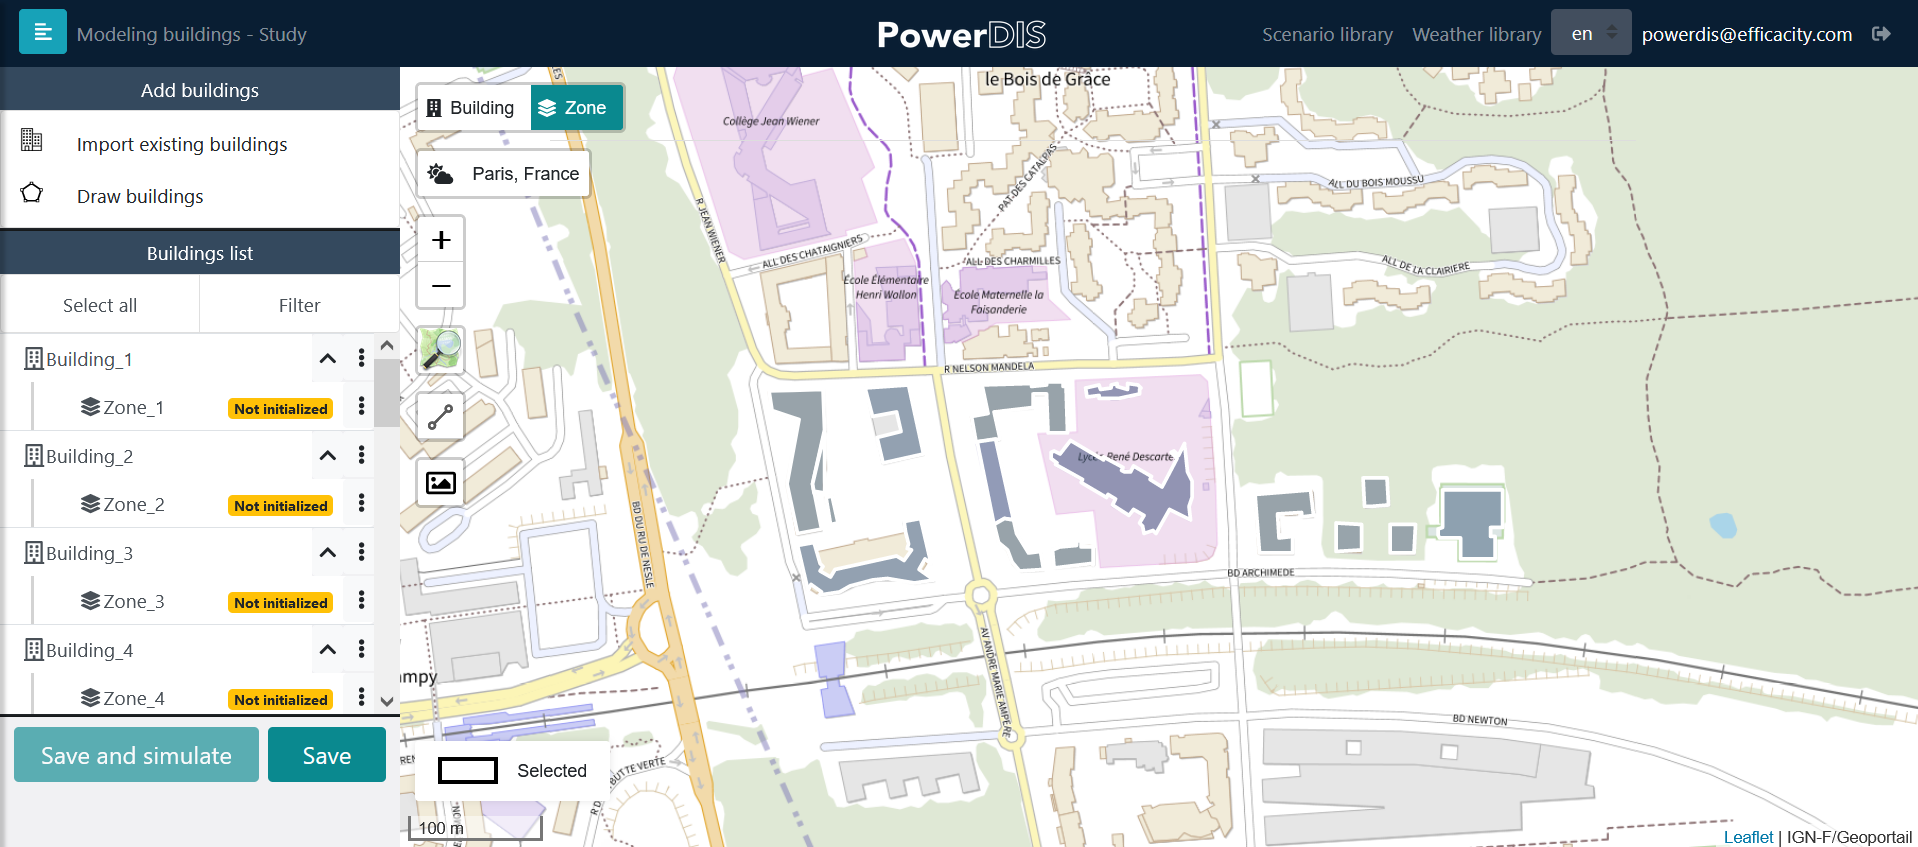
Buildings imported from the BD TOPO®
When the input is finished, you must click on the « Save » button to save the study. You can then return to the PowerDIS home screen if you wish.
By clicking on one or more buildings, you can change the characteristics of the imported buildings such as name, height, type, year of construction and envelope performance level via the right-hand side panel. The changes you make apply to the entire current selection, identifiable on the map or in the list on the left-hand side panel. This list also allows you to filter the buildings according to their characteristics in order to quickly make a multi-selection.
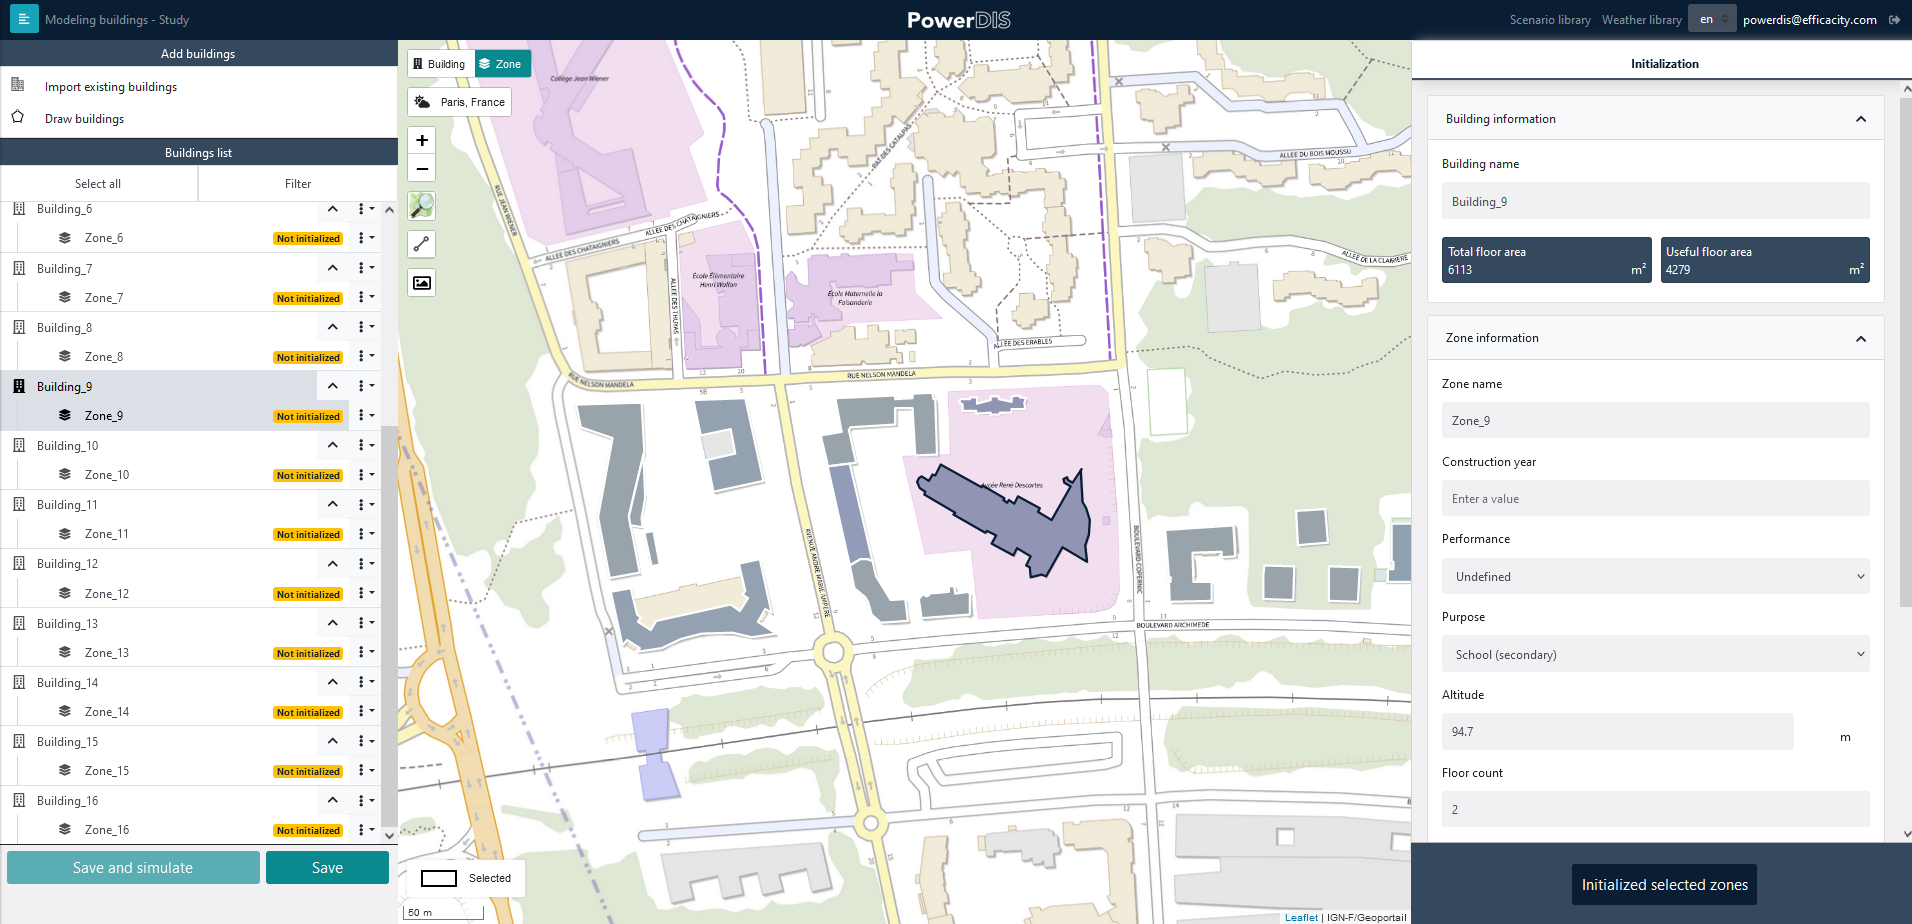
Panel for viewing and editing the main characteristics of the buildings
Note: it is necessary to click on the save button to save the changes made before closing the side panel or before editing other buildings.
Entering buildings manually
You can enter buildings manually by drawing their footprint and then entering their name, height, type, year of construction and envelope performance level. As in the case of an import from the BD TOPO®, this information will be used to automatically complete the thermal parameters of the envelope.
Before drawing the buildings, it is possible to import an image to guide the layout. It can be a project master plan for example. The import button is located on the left side of the window. It opens a Windows Explorer window allowing you to select an image file (.jpg or .png) to import into PowerDIS.

Image import button
Once the image is imported, you can resize it, stretch it, change its opacity or rotate it to match the IGN or OpenStreetMap background.
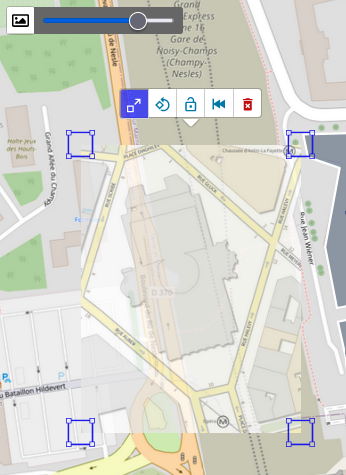
Image adjustment
Note: Currently, the image is not saved when the user returns to the dashboard, so it is preferable to finalize drawing the buildings before leaving the study.
The drawing of the footprints is then done using the building drawing tool located in the left side menu.

Building drawing button
When drawing a polygon, the user is given an indication of the distance of the segment being drawn. Polygons can be modified by dragging the vertices or the middle of an edge.
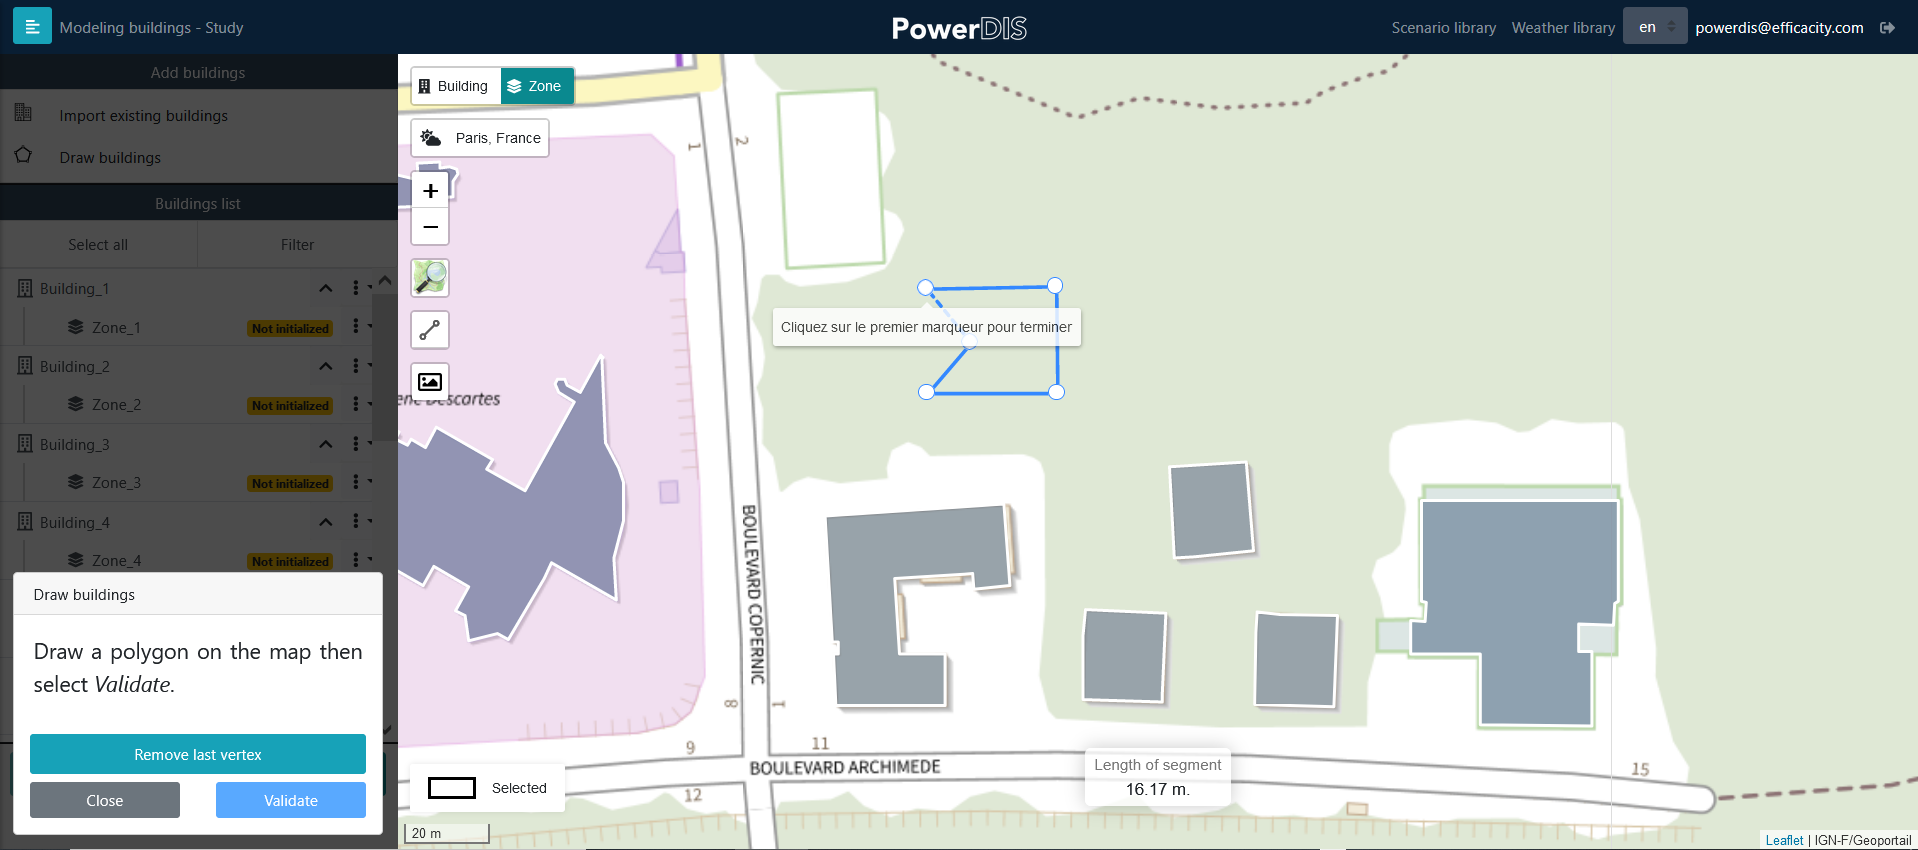
Manual entry of new buildings
The main characteristics of the drawn building can be modified from the right side panel.
You have the possibility to create several thermal zones to represent the same building, e.g. to represent a business at the ground floor of a building. To do this, click on add zone for the desired building.
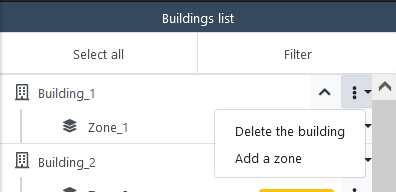
Adding a zone to a building
The created thermal zones then appear in the list on the left under their parent building. By clicking on a thermal zone, you can modify its characteristics in the right side panel as for a building.
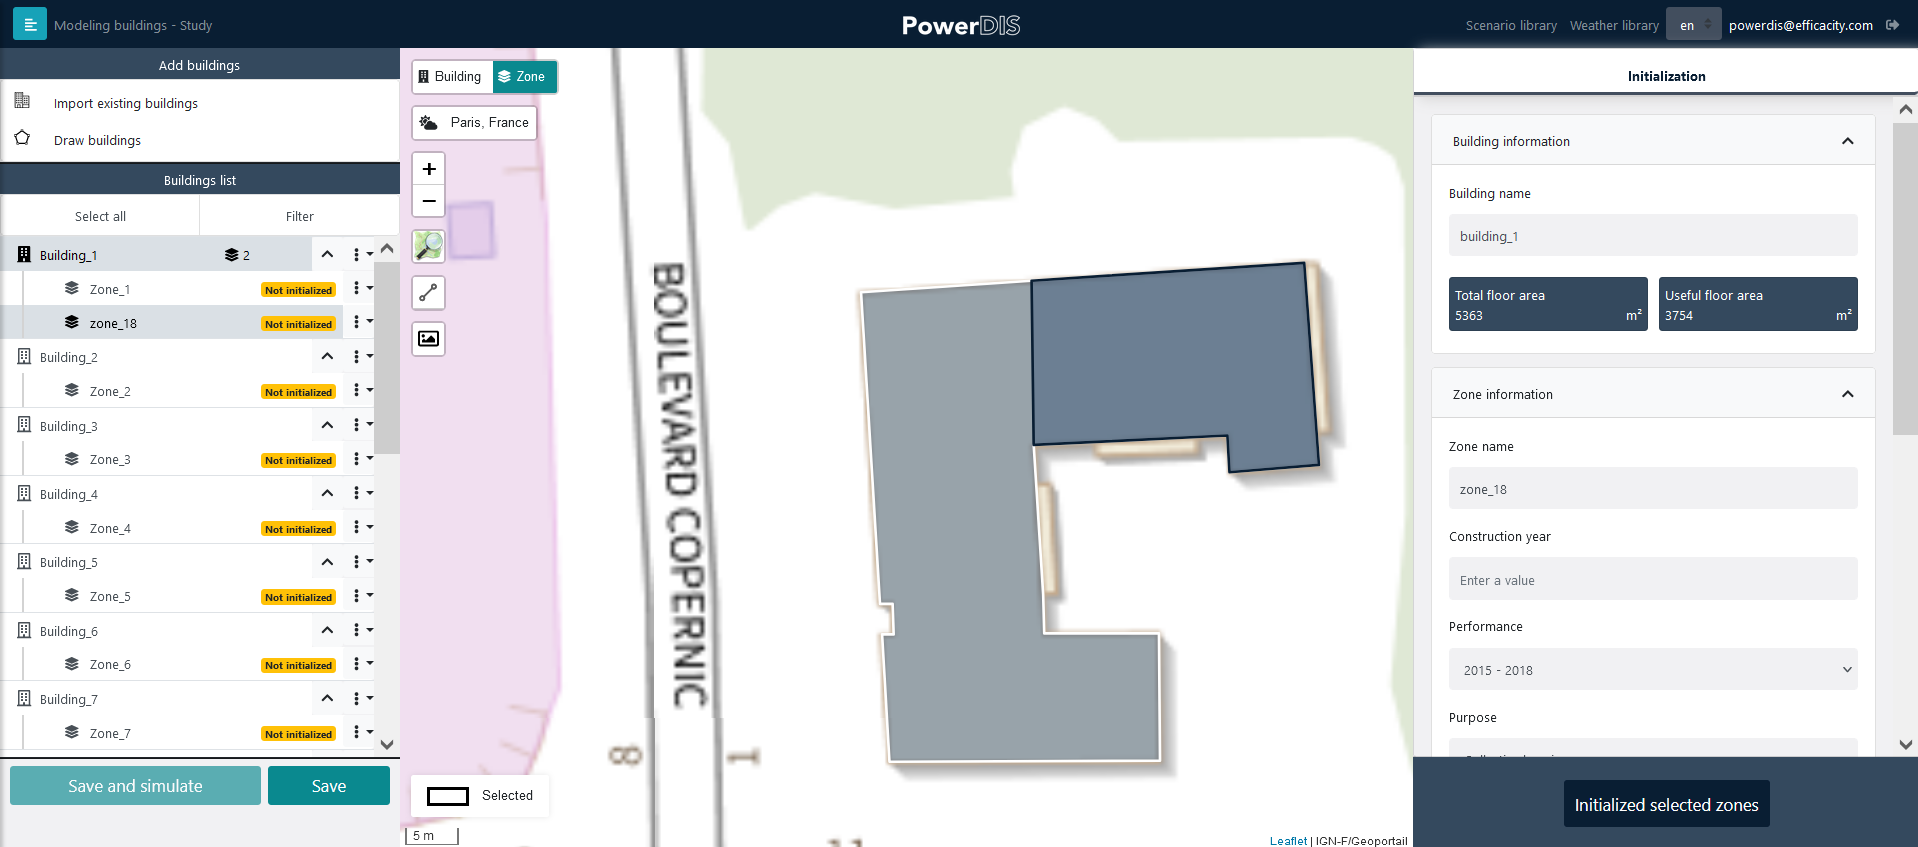
Changing the characteristics of a zone
For better readability, you can switch from the building view to the zone view by clicking on the two icons located in the upper left corner of your project map.

Switch from building to thermal zone view
Building modelling: envelope and scenarios
Parameterization and simulation of a study
A study usually starts with the parameterization of the district energy model of the district, i.e. entering the input data. After clicking on the study, the main screen shows an IGN (or OpenStreetMap) map on which the footprints of the buildings in your project are superimposed.
When your modifications of buildings characteristics are finished, you can proceed to the parametrisation of the envelope and the scenarios by clicking on the « Initalize selected zones » button on the right-hand side panel.
You now have access to a panel allowing you to modify:
The exterior envelope: heat transmission coefficients of vertical and horizontal walls, including glazed surfaces, the type of ventilation (single flow or double flow), the infiltration rate and the position of blinds.
The scenarios among which: indoor temperature setpoints, heat input, ventilation flow rates and DHW extraction.
The completion of the envelope parameters is done automatically by PowerDIS when the building typology and its envelope performance level are entered before the initialization of the thermal zones. All the parameters of all the buildings of the study can be modified even if they are automatically pre-determined by PowerDIS.
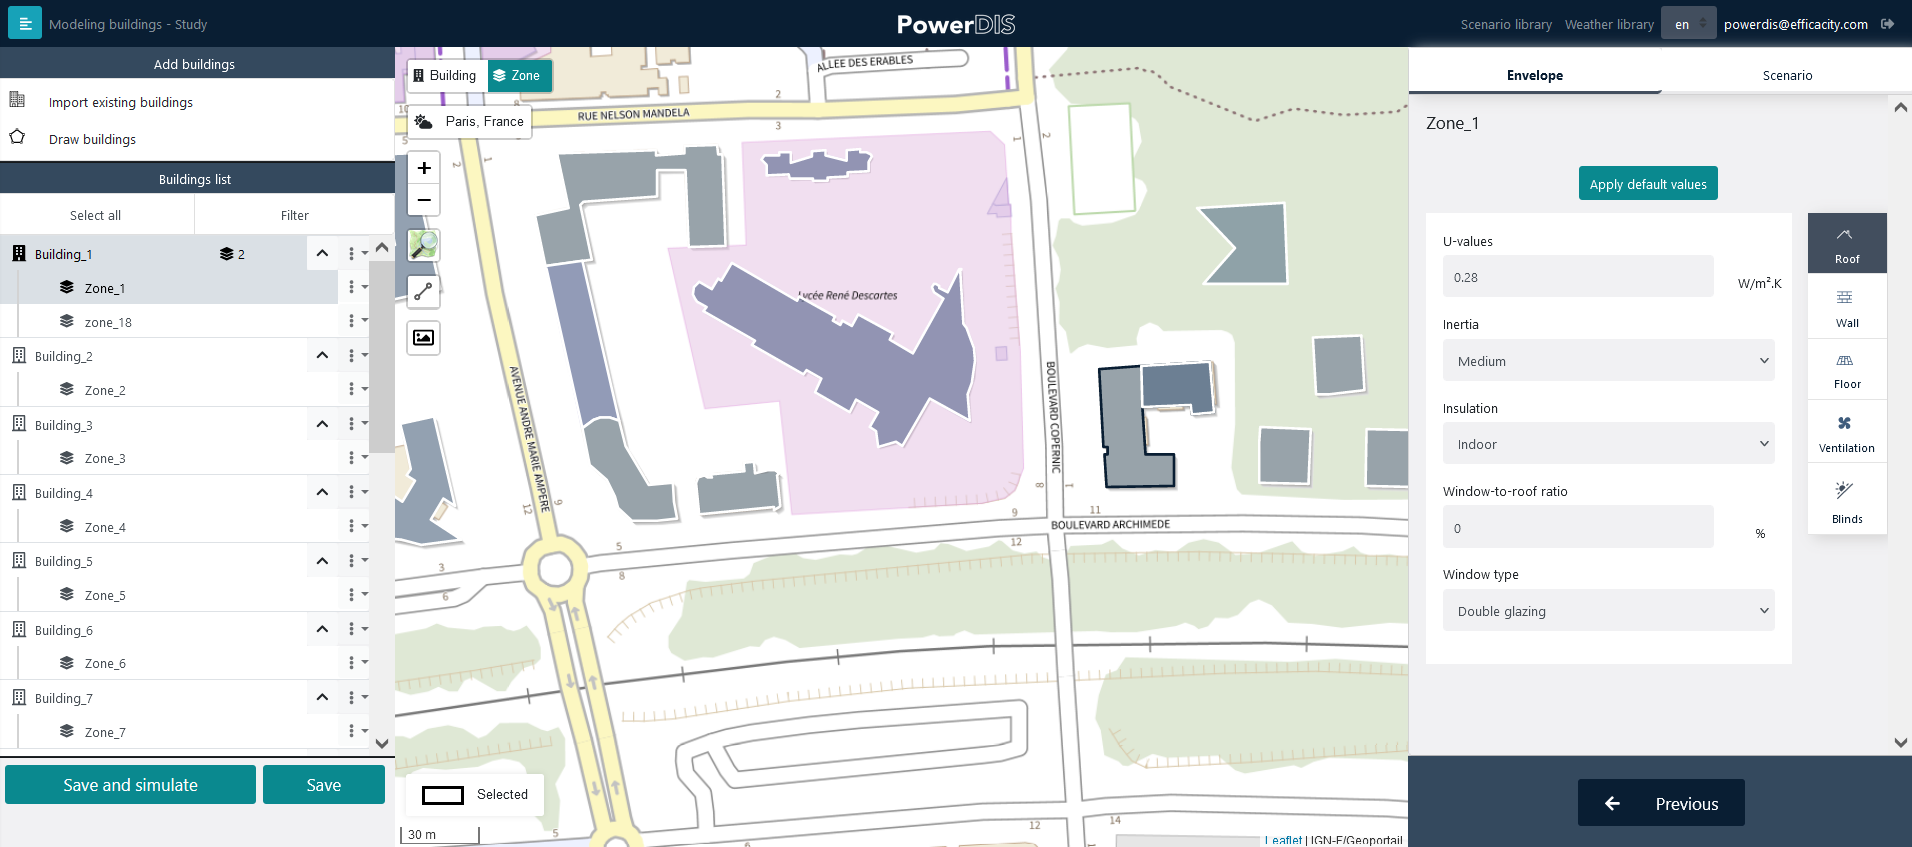
Input of building envelope parameters
Scenarios can be entered by clicking on the Scenarios tab and selecting the desired scenario for:
The heating setpoint temperature
The cooling setpoint temperature
The DHW extraction flow rate
Ventilation flow rate
Internal metabolic inputs
Electric appliances consumption
Hourly scenarios for different types of buildings are proposed in PowerDIS, based on the 2012 French Thermal Regulation. In the example below, the user assigns a scenario of heating temperature set point for collective housing to all the selected buildings.
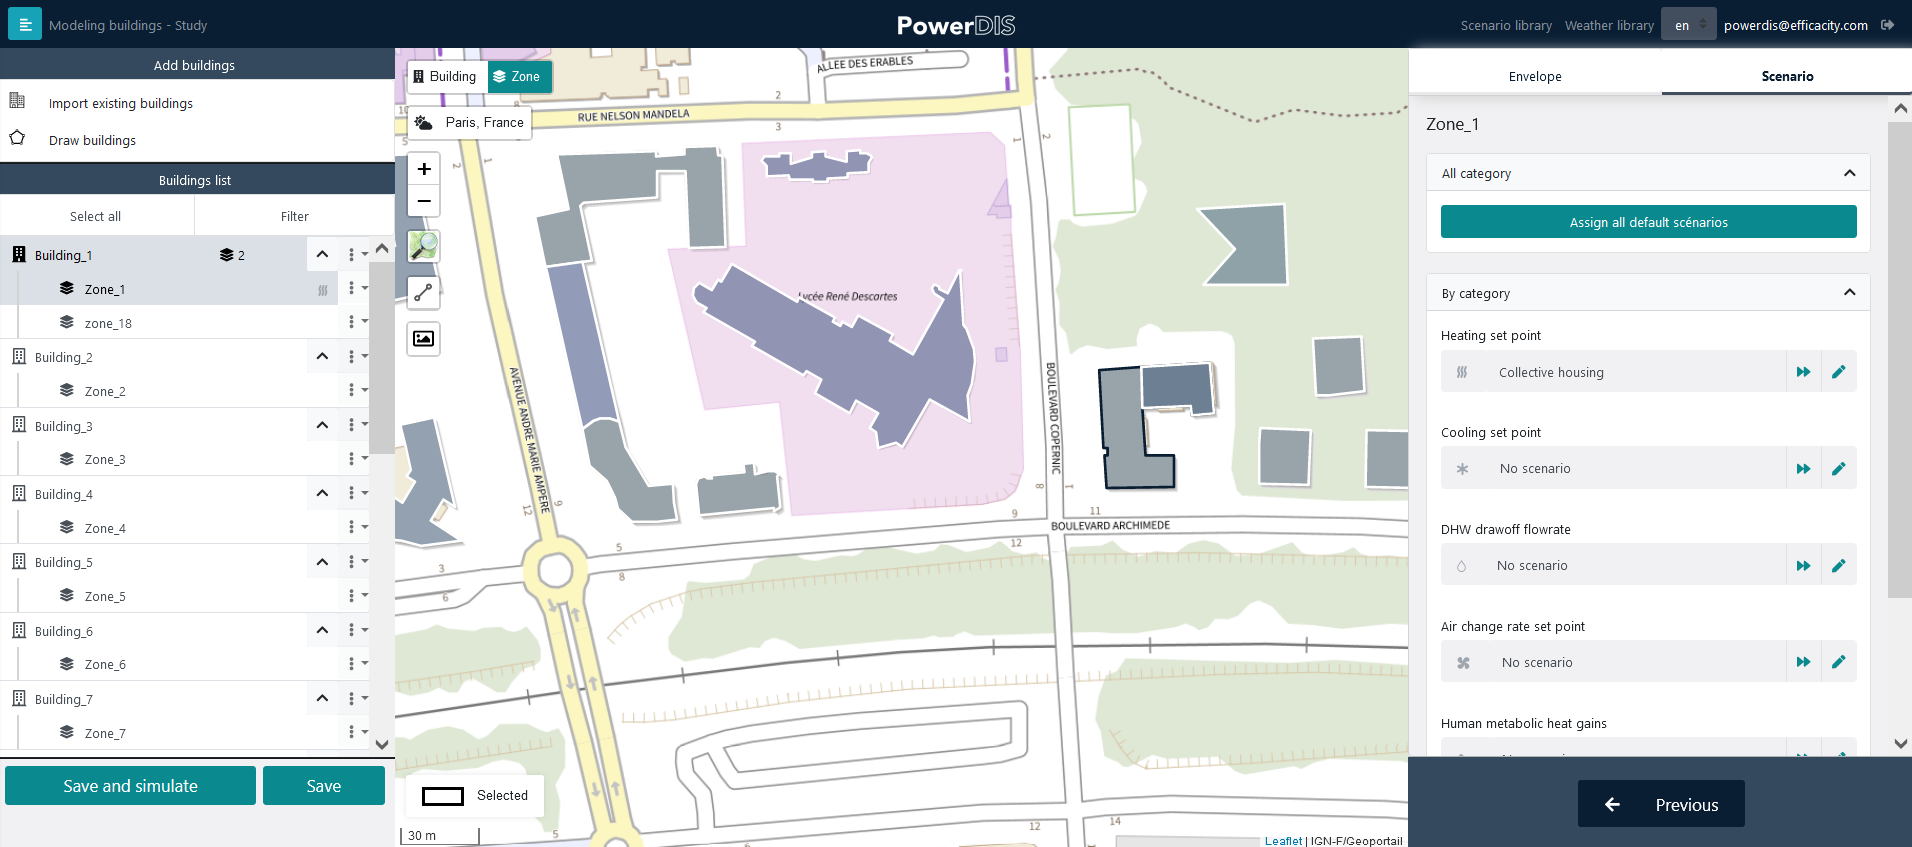
Building scenarios selection
Note: you can apply all the default scenarios to a thermal zone by clicking « Assign all default scenarios ». It is also possible to apply the default scenario of only one type of scenarios by clicking the symbol representing two arrows on the right-hand side of the scenario field.
As you enter the scenarios in each thermal zone, icons allow you to follow the assignment of the scenarios to each of them.
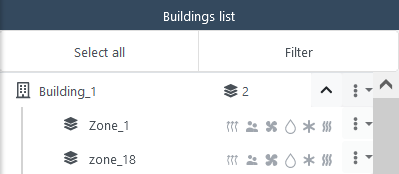
Scenario assignment icons
When the input is finished, it is recommended to click on « Save » so that the parameters are taken into account in the simulation.
If you want to get more details about the scenarios of the 2012 French Thermal Regulation, you can click on Scenario Library located in the top bar of your window.
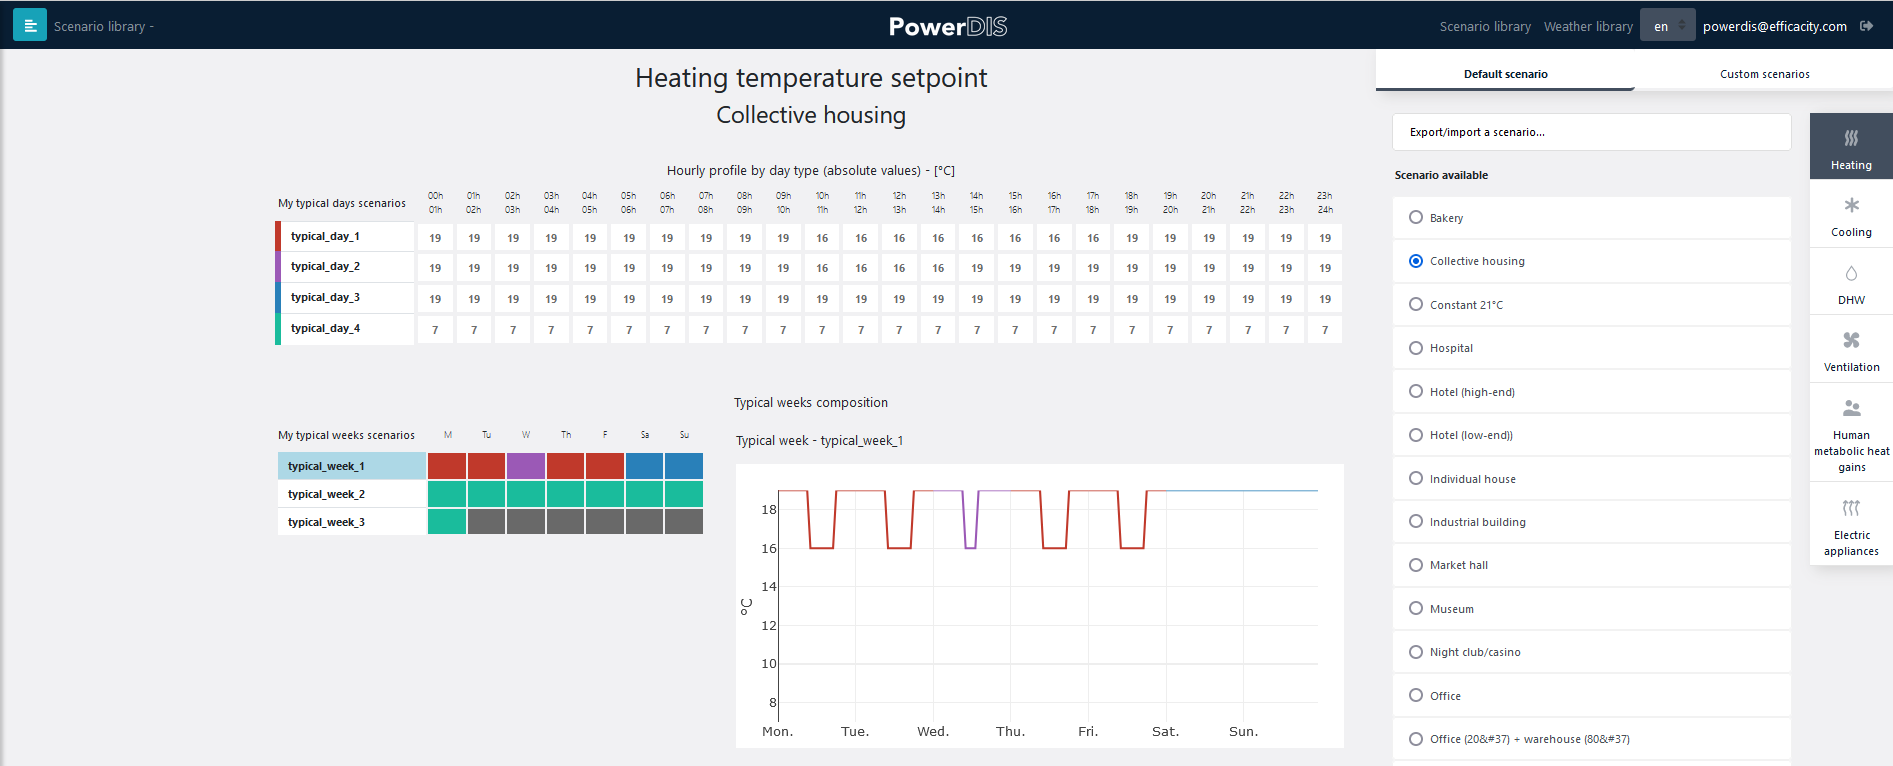
Scenario library
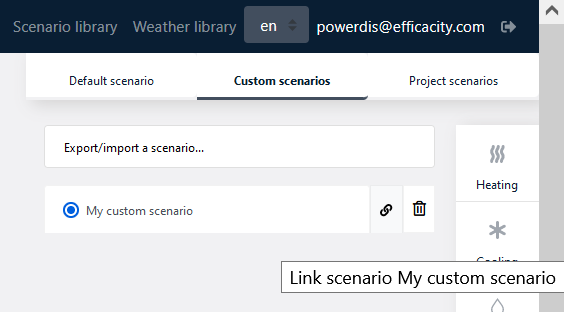
The scenario library also allows you to export or import scenarios. This gives you the possibility to define your own scenario for your project using an empty template file. Your new scenario will then appear with the other scenarios in the library and you can apply it to the buildings in the project. For more details about the scenario library, you can refer to the dedicated section at the end of this tutorial.
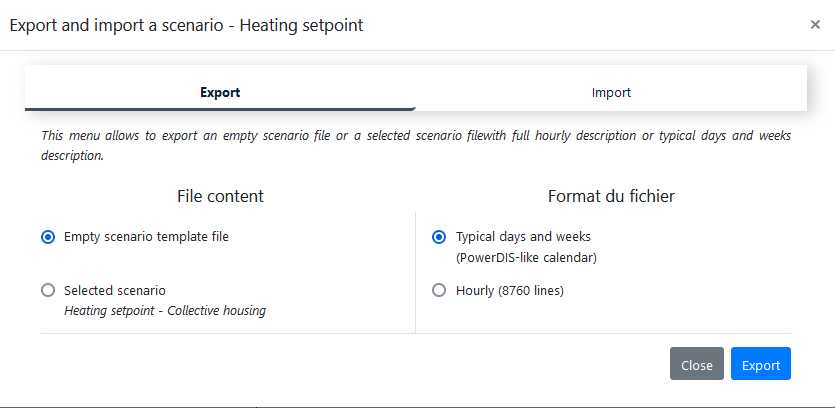
Scenario export / import window
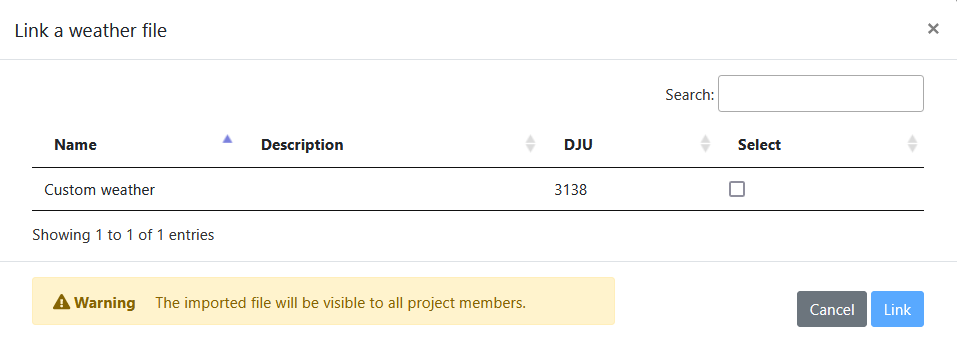
Before launching a simulation, you must choose a weather file which will be used for the calculations. By default, the file located closest to your project will be selected, but you can change this input by clicking the button at the top left of the map.
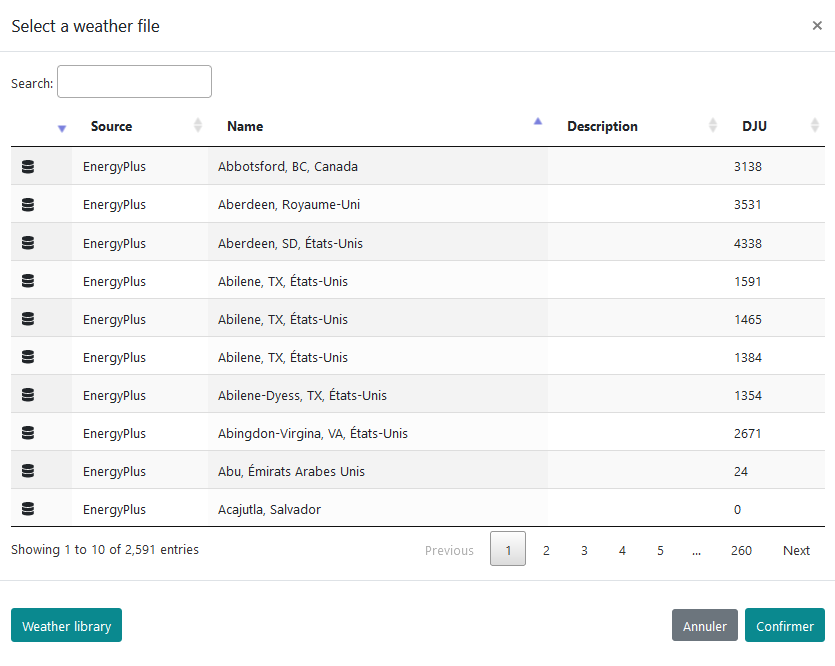
Weather choice window
Warning: If you use weather files in .epw format, it is recommended to use only files having a latitude and longitude close to those of the project (at least the same time zone for the longitude and the same hemisphere for the latitude). Using a location that is too far away and for which the sun’s path is different can lead to errors in the calculation of solar gains for the simulated areas.
To run a simulation of the study, click on Start simulation. A window recalling the wheather file used for the study appears before the simulation can be finally launched.
The status of the simulation is displayed on the home page. If the simulation fails, the user is warned by an error message. This may be due to incomplete or incorrect model settings. When the simulation of a study is in progress, it is indicated as follows.

Simulation in progress
When finished, the simulation is displayed with a tag in green with the indication Building loads results available, meaning that the simulation results of the thermal needs of the buildings are available. If the simulation status does not refresh, it is possible to refresh the page to update its status (F5 button or Refresh in the browser).
Filter buildings
It is possible to filter the buildings by type, performance level or year of construction to make a quick selection at any stage of the study. The filters can be combined by clicking on Add to selection. This menu is accessible by clicking on the Filter button in the list of buildings.
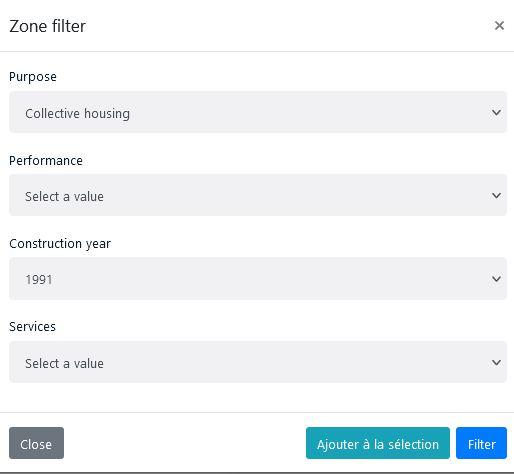
Multi-selection by building filter
Selecting energy systems
The input of HVAC systems and district heating networks is possible once the input of the buildings and the simulation of the thermal needs are done.
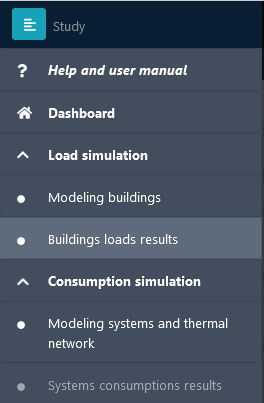
Access to the input of systems and heating networks
Note: At each step of the system entry described below, it is recommended to save the changes made before closing the right side panel.
Input of HVAC systems at the building scale
Choice of HVAC systems
You can define the HVAC systems installed in each building by clicking on Buildings in the left sidebar. The HVAC systems are then entered at the level of one or more thermal zones through the right side panel.
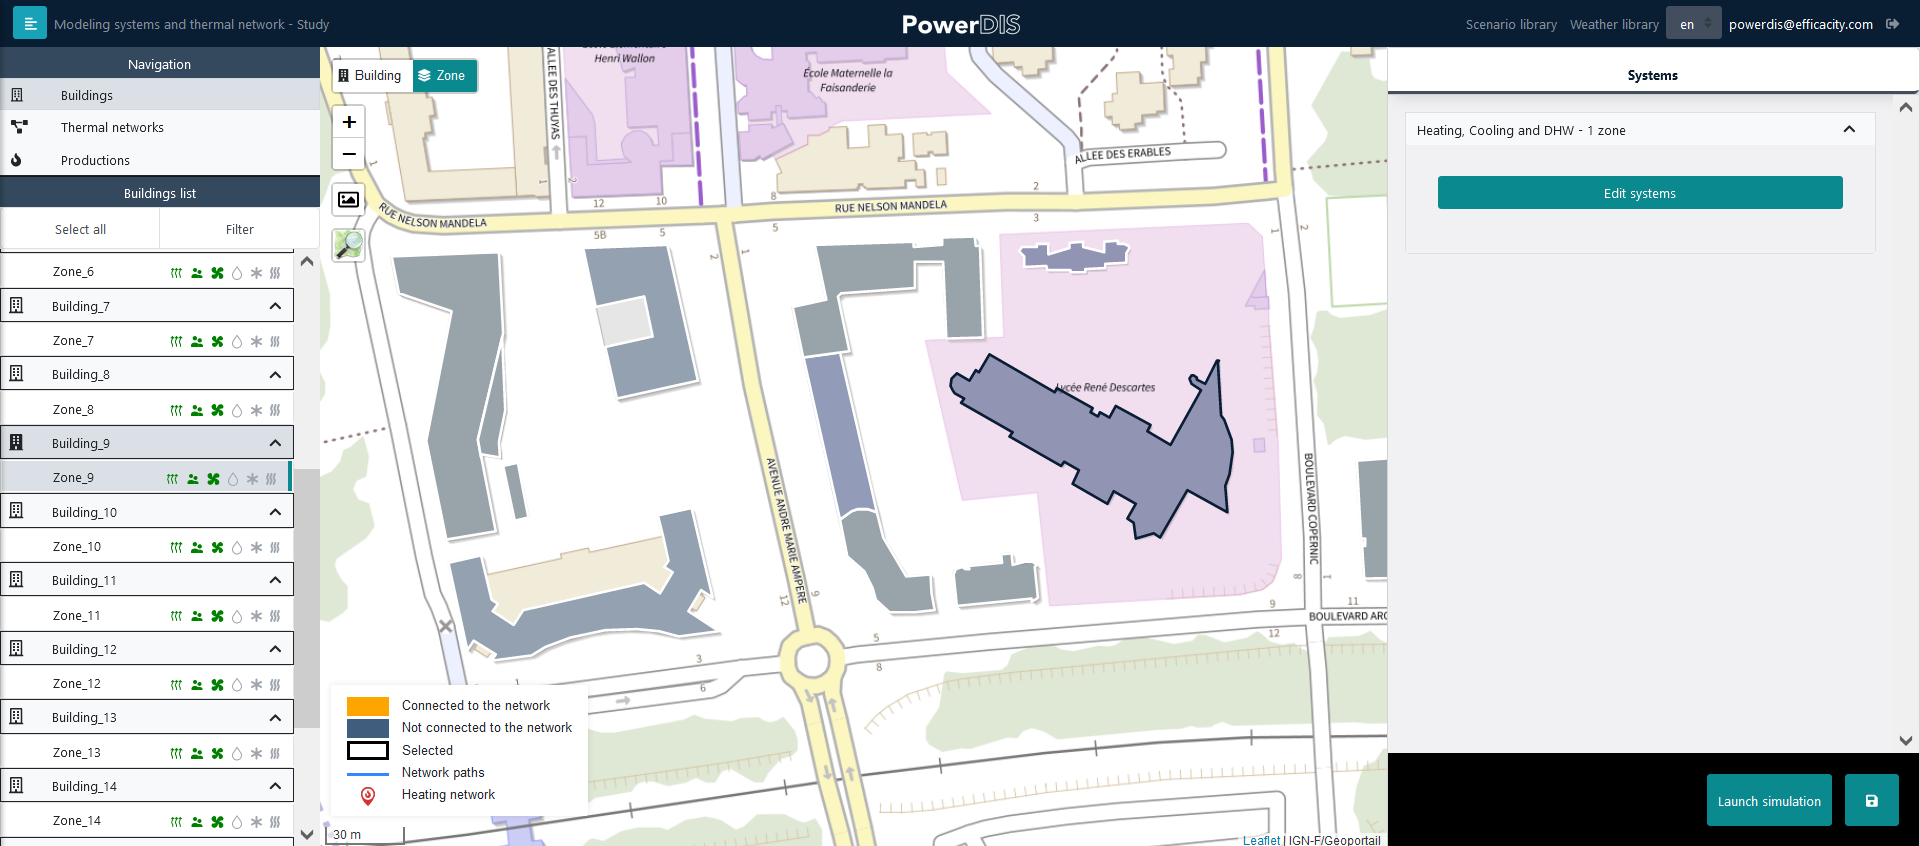
Overview of system entry in the study edit page
You can select systems associated with the scenarios defined for each zone or building by clicking on Edit Systems. It is possible to select up to two different systems for each building, in addition to the ventilation system declared in the envelope parameters. It is also possible not to declare a system for a scenario entered in the building (for example, a cooling scenario is declared but no cooling system). In this case, no simulation will be carried out to ensure the cooling.
This can be useful, for example, if you want to represent the solar mask of buildings around your project without modeling the needs of these buildings.
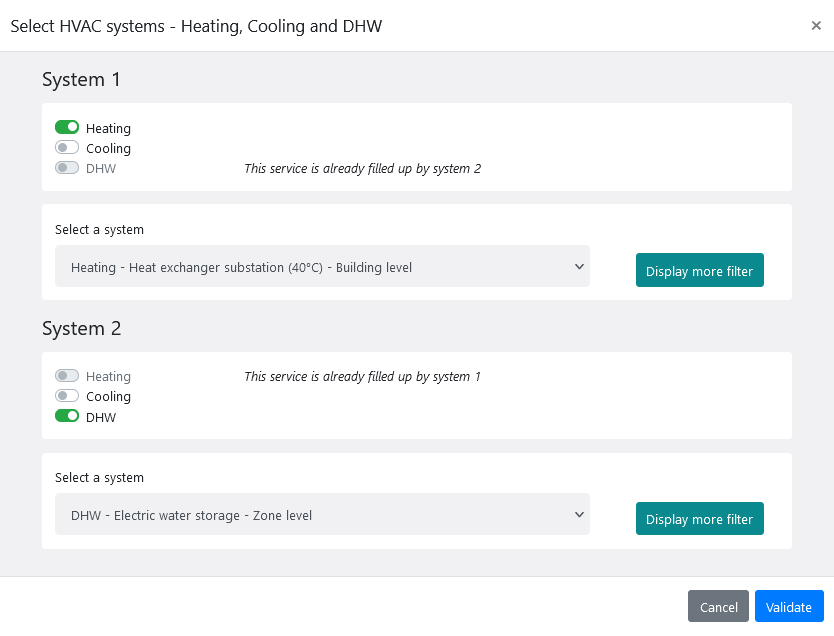
Building HVAC system selection window
However, it is not possible to:
Select a system delivering a service not declared in the scenarios. For example, it is not possible to select an air conditioning system when no air conditioning scenario has been entered. In this case, it would be impossible to determine the setpoint temperature to be provided and therefore to determine the associated consumption.
Enter two systems providing the same service in the same building, e.g. if the user chooses a dual service gas boiler for heating and hot water, then no additional heating or hot water systems should be entered in this building.
Connecting a building to a district heating network
To connect a building to the heating network, one needs to declare at least one substation system in the building. Buildings with a substation that are to be connected to a heating network are colored in orange on the map.
If at least one building is equipped with a substation, then the entry of a heating network (route and central boiler room) is mandatory. An entry is then requested by PowerDIS in the navigation tab of the left side menu by clicking on Thermal networks and Productions.
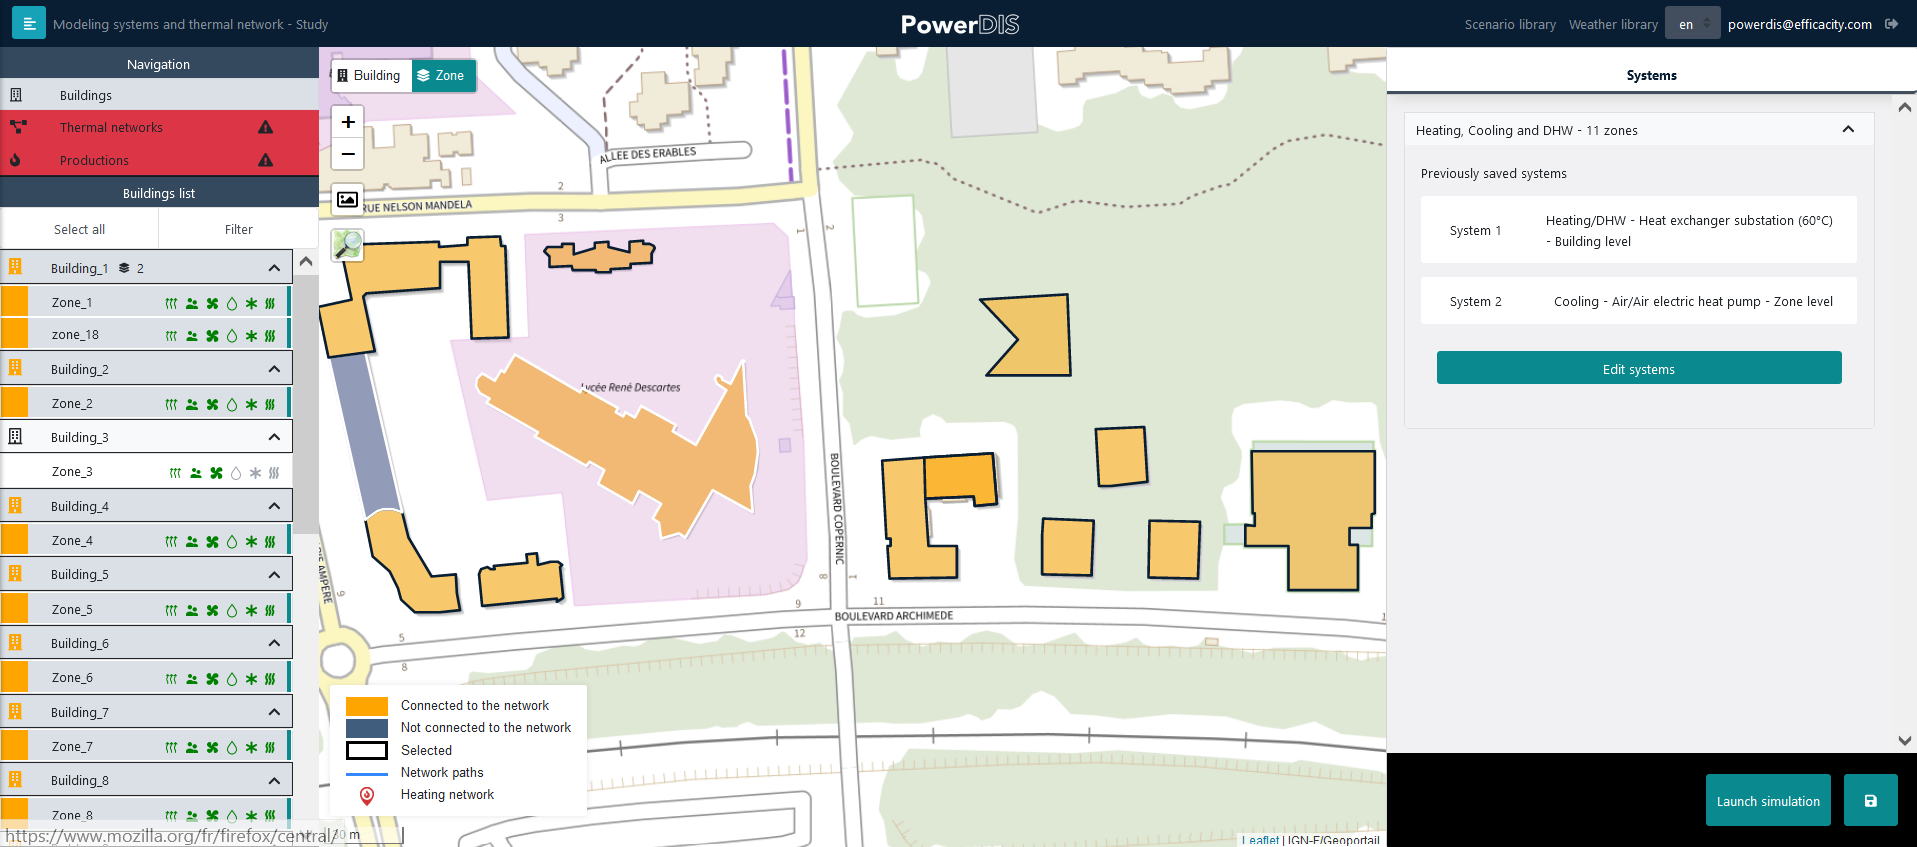
Examples of buildings equipped with substations connected to the heating network
If no buildings are to be connected to the heating network, the user can directly simulate the study including the buildings and their decentralized HVAC systems. In this case, you may click on Launch simulation after entering the systems in the buildings to get the energy consumption results.
Note regarding systems in buildings
Unless otherwise stated in the system name, all systems are designed for inlet/outlet temperatures of 60/45 °C for heating and 7/12 °C for cooling.
More information about system sizing and modeling can be found in the expert documentation section: http://doc.powerdis.test.efficacity.com/docs/5.%20systems.html
Describing a district heating network
Defining a district heating network is possible in the menu Heat networks accessible in the left side menu. This is only necessary if the user has selected substation type systems in at least one building of the project. If this is not the case, the user can click directly on Start simulation to obtain the energy consumption results.
Network layout
The layout of the network starts by clicking on the dedicated button illustrated below. This button is used to enter the « possible paths » of the network layout. From all possible paths entered by the user with this feature, PowerDIS will automatically determine the « optimal » network path according to the location of the boiler room and the buildings to be connected.
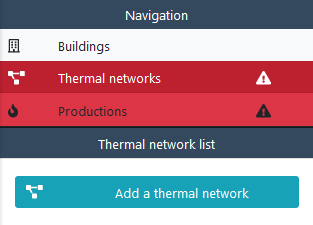
Button to start indicating the possible paths of the network
The layout is done by drawing the segments one by one. The order in which the segments are drawn does not influence the direction of water flow in the future network. The « terminal » antennas connecting the network to the substations inside the buildings do not have to be drawn. They are automatically determined by PowerDIS during the simulation from the shortest path between the nearest segment and the concerned substation. An example of a route is shown in the image below.
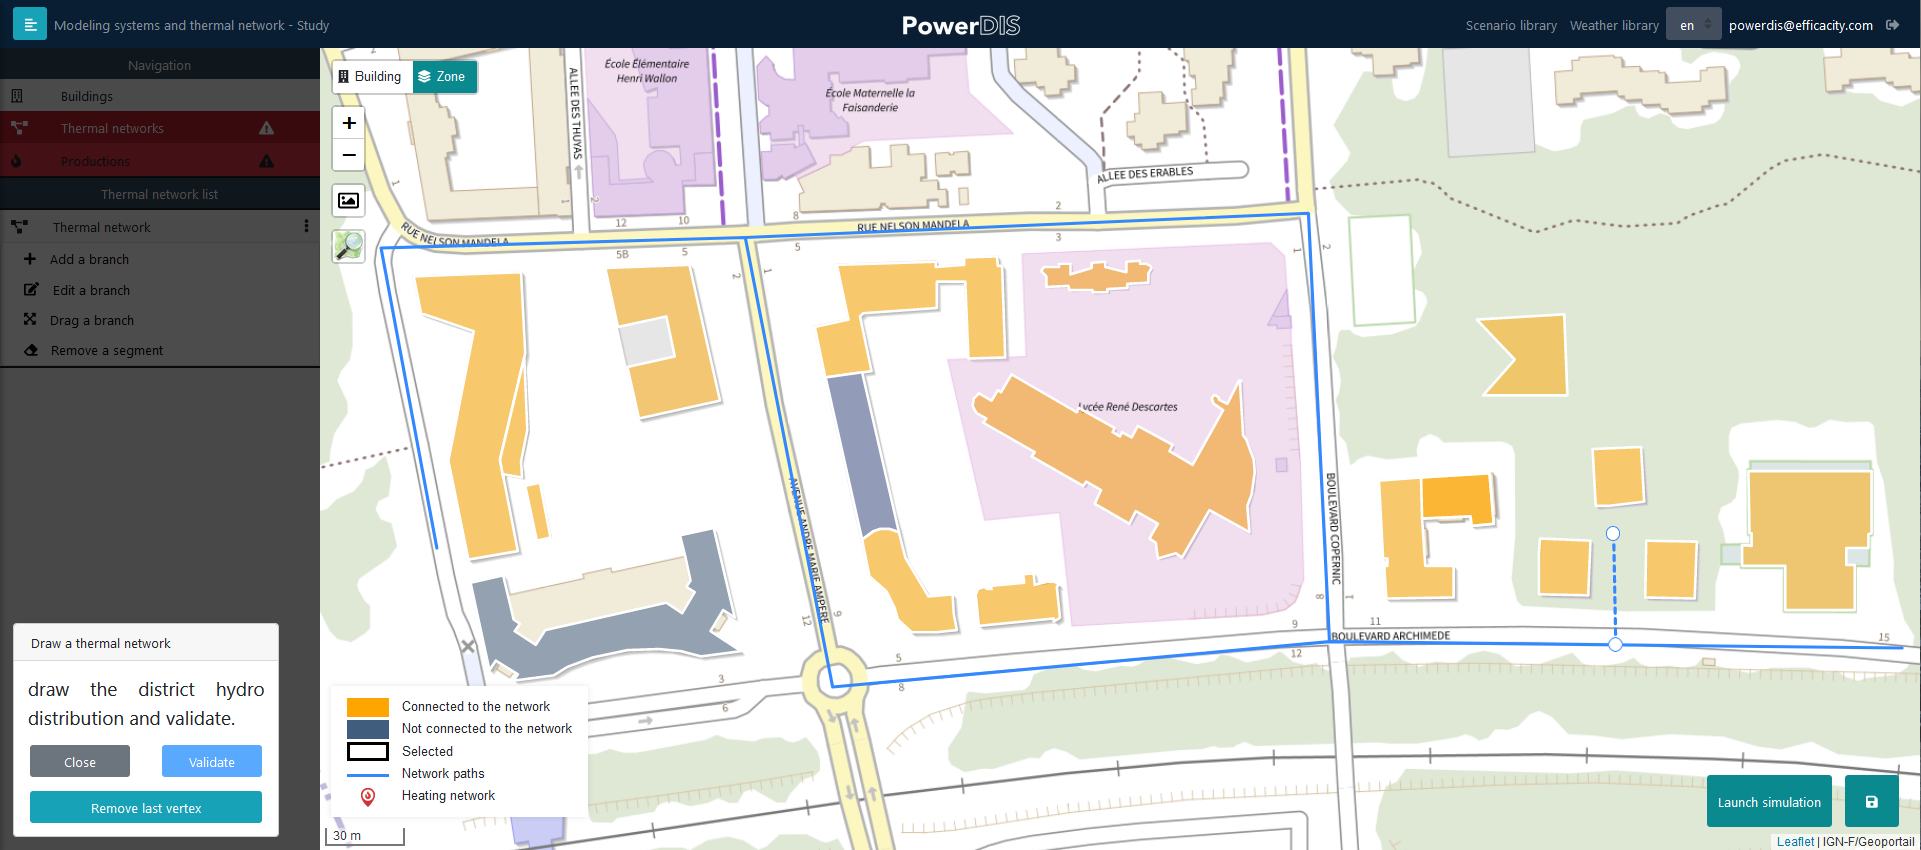
Example of network layout
Plotting a network can be done in several steps. To do so, you just have to click on Validate in the left menu after having drawn one or more segments. You can then add new segments by clicking on Add a branch in the left side panel.
Boiler room definition
To enter the boiler room, you must first select the location of the boiler room by clicking on the button provided for this purpose. The boiler room can be directly located on the district heating network layout or not. In the latter case, PowerDIS will connect the boiler room to the nearest segment of the network layout.
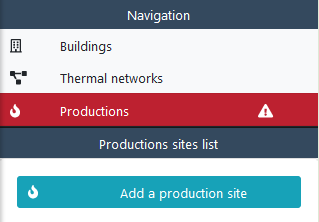
Button allowing to define the boiler room’s location
The boiler room can be set up through the right side panel. This panel opens directly and remains open as soon as the boiler room is positioned on the board.
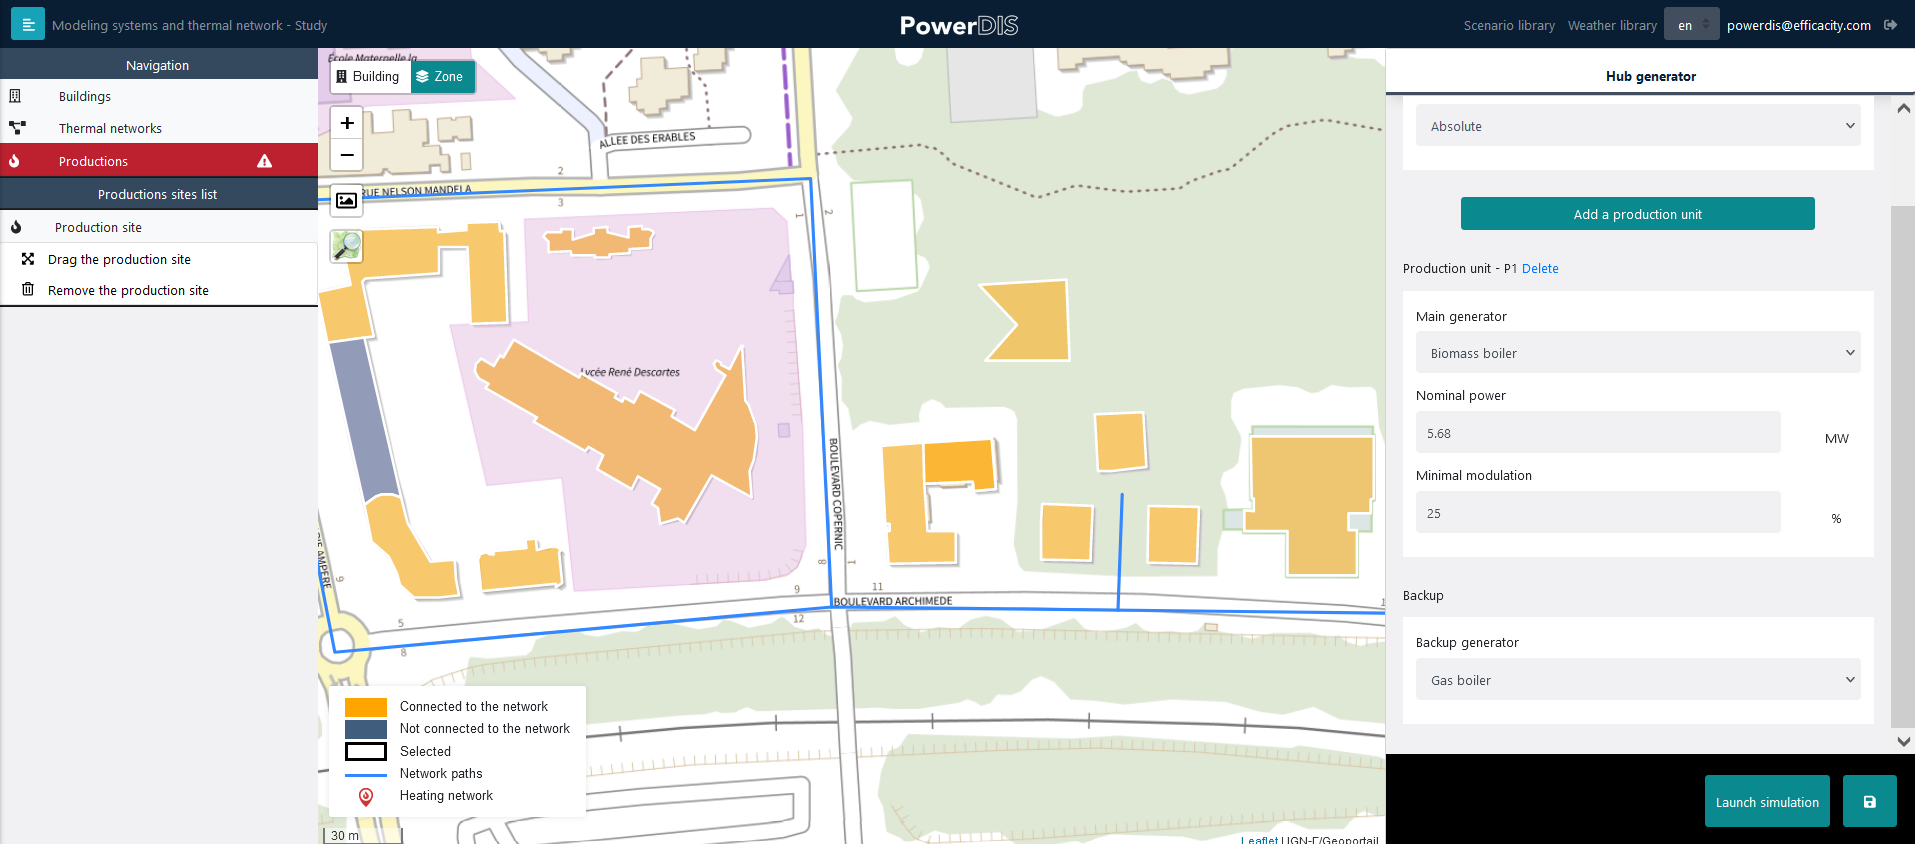
Side panel of the boiler room
This panel has several distinct parts.
First of all, the first field Nominal power definition allows you to choose whether the power ratings of the generation units are entered in a relative or absolute way. If the value absolute is selected, the power of the generators must be given in MW. If the relative option is selected, the user chooses the nominal power of each generation unit according to its share (%) of the maximum power required by the whole network that PowerDIS is sizing.
Adding a production unit is done by clicking on the colored button Add a production unit, each new generator is automatically placed before the backup unit in the list of generators.
The order in the list represents the merit order for the production units. The order of priority is indicated by P1, P2, etc.
The deletion of a production unit is done by clicking on delete.
The parameterization of each generation unit is done using three fields that define the technology used, the nominal power of the generator (or its share of the maximum power) and finally the minimum modulation threshold (technical minimum) of the unit.
The back-up generator (last in the list) is systematically sized on the nominal power of the network in order to guarantee that the power is supplied to the network in all circumstances, even if the user had not entered enough power in the main generators. This back-up generator is therefore not configurable in nominal power nor in minimum operating threshold to guarantee the energy supply.
In the example below, the user has chosen to enter the power of the production units in relative.
The first generator chosen by the user is a biomass boiler with a nominal output of 50% of the sizing value of the heating network. This biomass boiler cannot be switched on below 25% of its maximum load.
The second generator in the order of priority is a condensing gas boiler with a rated output of 60% of the design value of the heating network. This gas boiler cannot be switched on below 10% of its nominal load.
Together, these two generators represent 110% of the network’s nominal power. On top of that, the back-up generator (also a condensing boiler in this case) adds 100% of the network’s sizing power, thus accumulating up to 210% of the sizing power if all generators are added together.
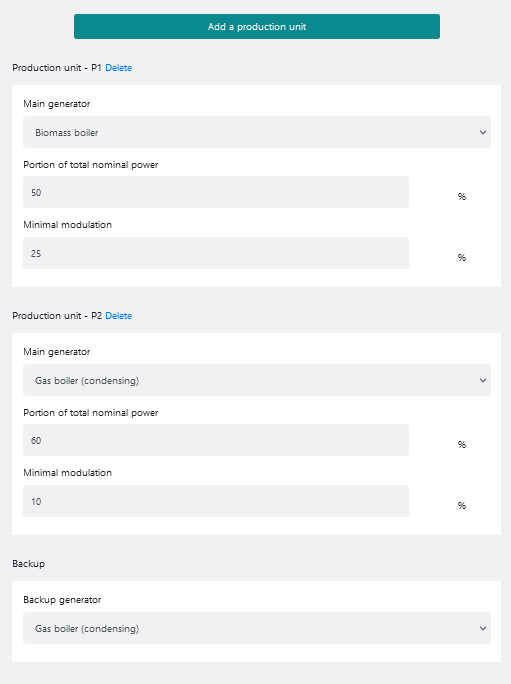
Example of inputs for a boiler room
When all these steps have been completed and saved, the simulation can be started by clicking on Start simulation. The simulation of the current system consumptions is shown in the status bar of the study in the Dashboard.

Simulation of energy consumption in progress
Exploitation of the results
Results of a building loads simulation
Once the simulation of the thermal needs of the buildings of a study is successful, it is possible to access the result page by clicking on the study in the home page and then selecting the results of loads in the side panel as in the following image.
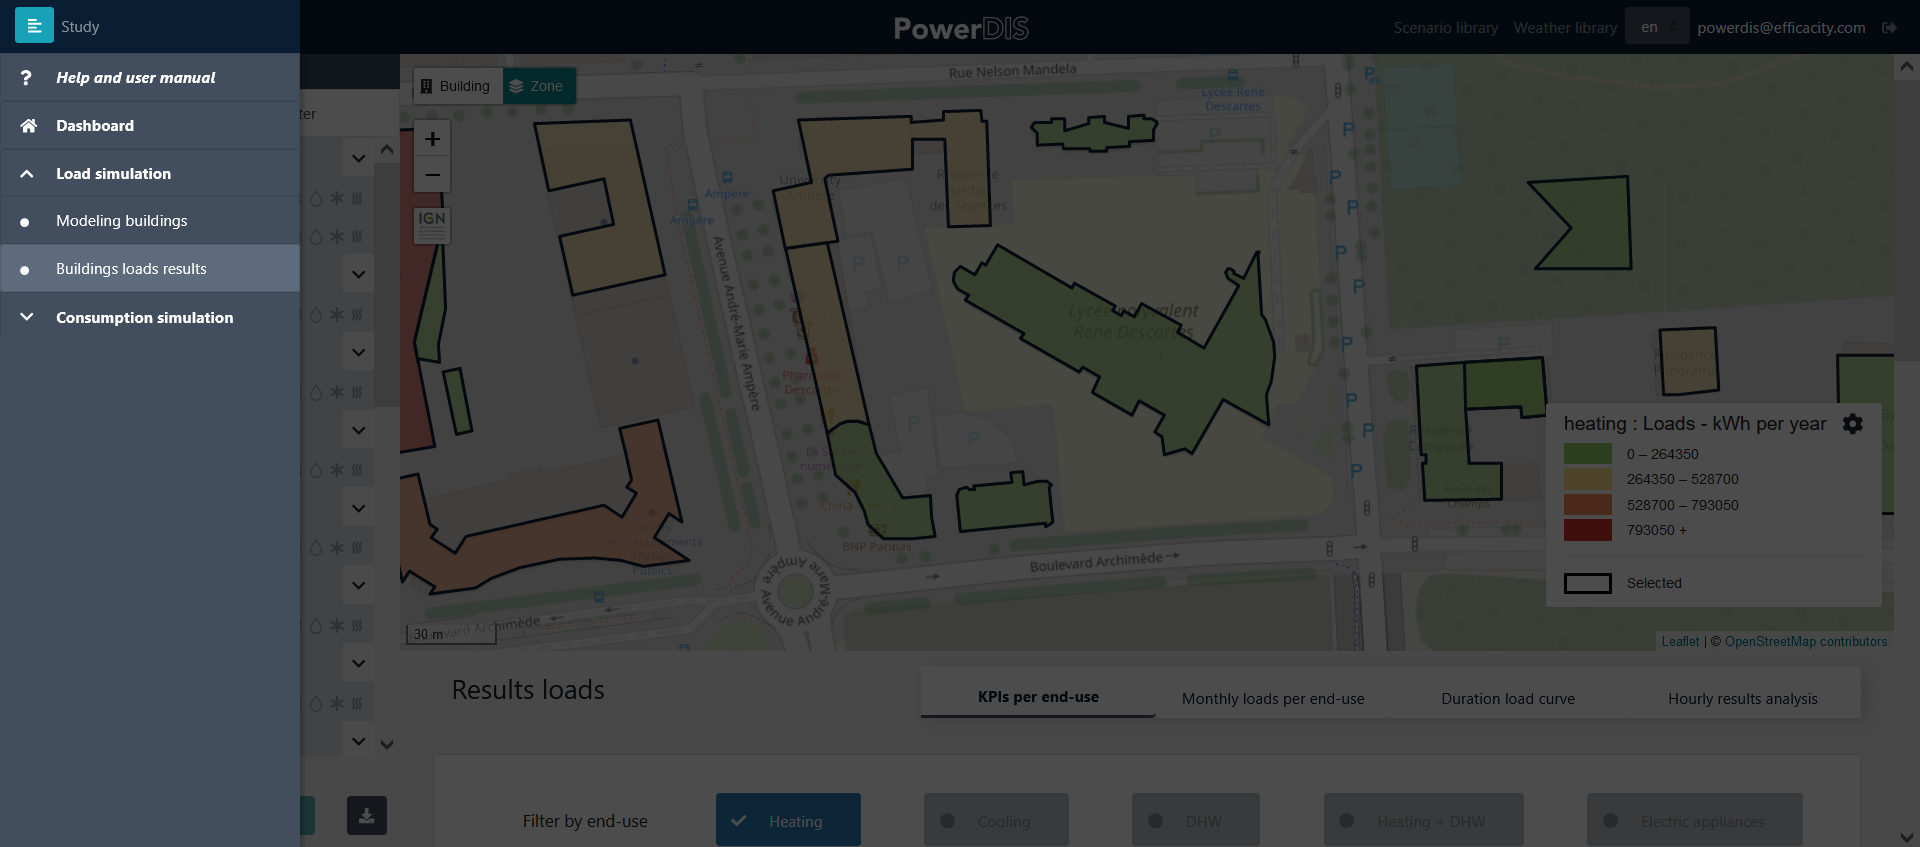
Choice of load results
The PowerDIS interface displays the project map and the result graphs underneath. By default, all buildings are selected and the annual indicators by energy use are presented to the user. The name of the buildings corresponds to the one provided when the project was initialized.
It is possible to deselect and reselect buildings on the map by clicking on them. To update the graphs corresponding to the new building selection by clicking on the Update results button in the left side panel.
The map has a legend (bottom right) that shows the high and low points for each color. The map formatting and legend can be configured at any time by clicking on the gear icon in the legend. The following menu is presented to the user to select the energy use for which to format the map and the energy indicator to be displayed (energy or power, in absolute or surface values).
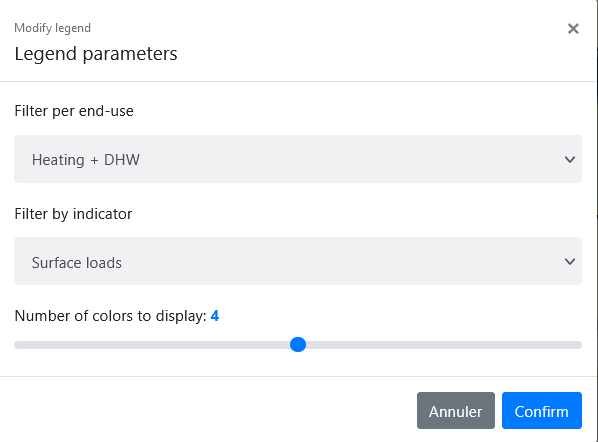
Map legend settings
Four types of results are proposed:
Annual indicators by energy use: these are annual energy indicators for each building for which the user chooses the use to be displayed in a summary table. Global indicators for all the buildings in the selection are also displayed at the top of the page.
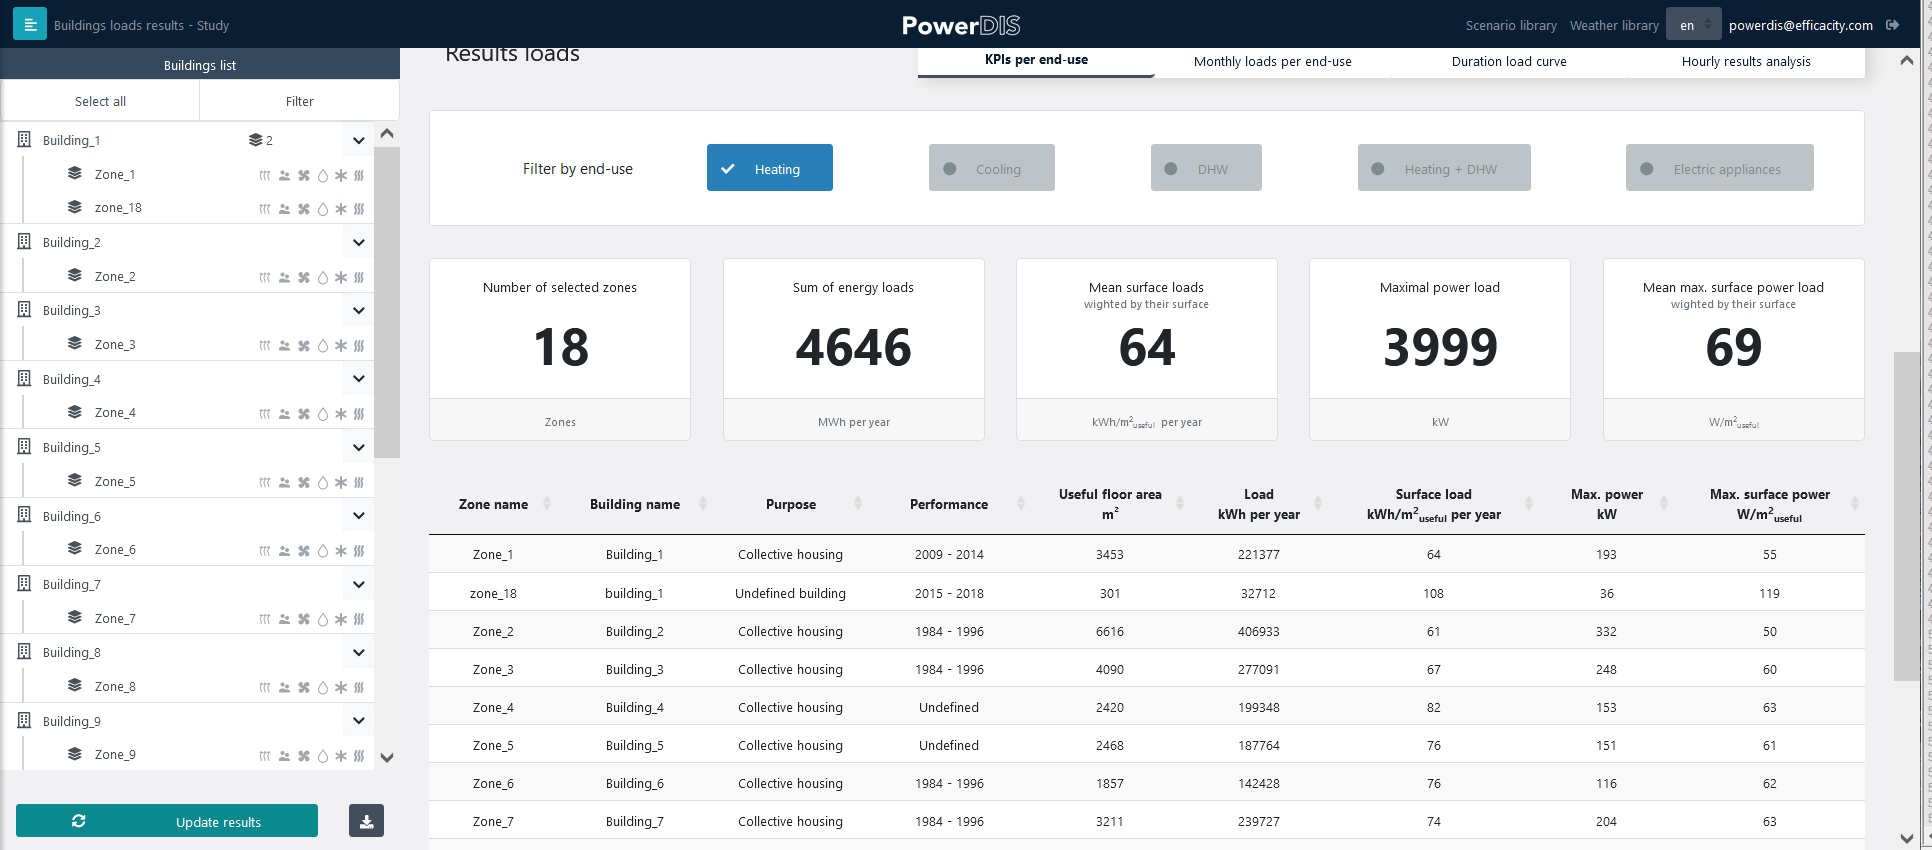
Yearly energy use KPIs
Breakdown of uses by month: this is a stacked histogram showing the sum of the energy loads of all the selected buildings.
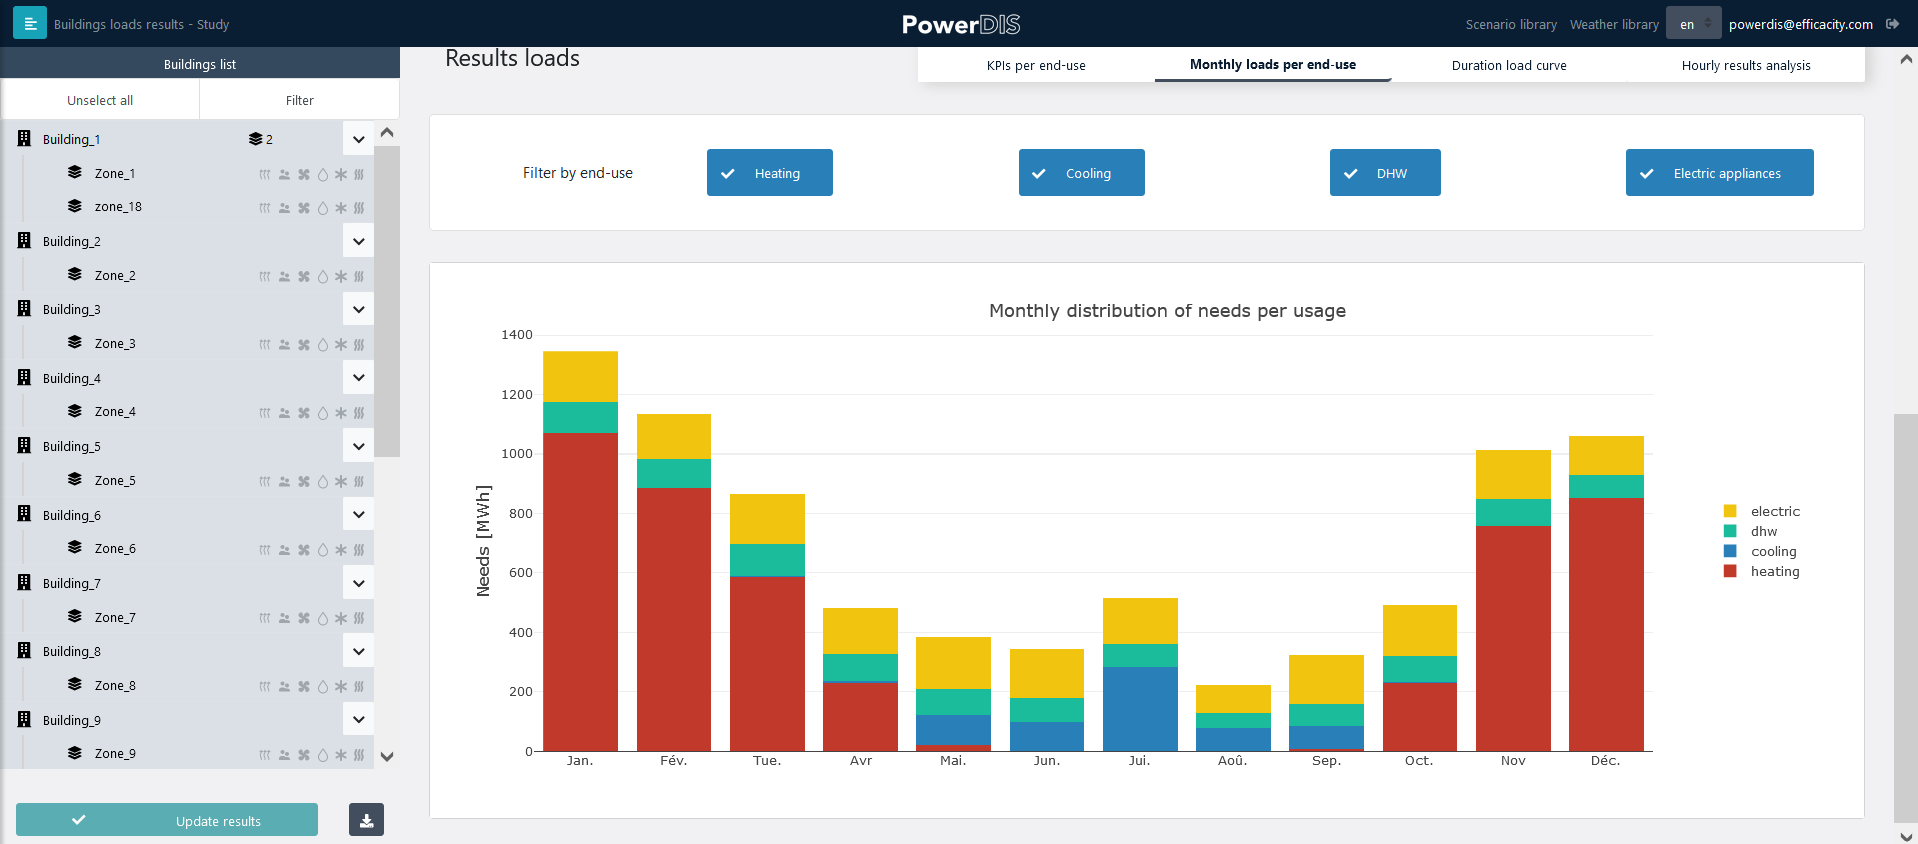
Monthly energy needs breakdown
Duration load curve: this graph displays the hourly power of the sum of the loads associated with the selected uses and buildings. The values on the x-axis are the amount of hours during which the requested power is at least equal to the y-axis value.
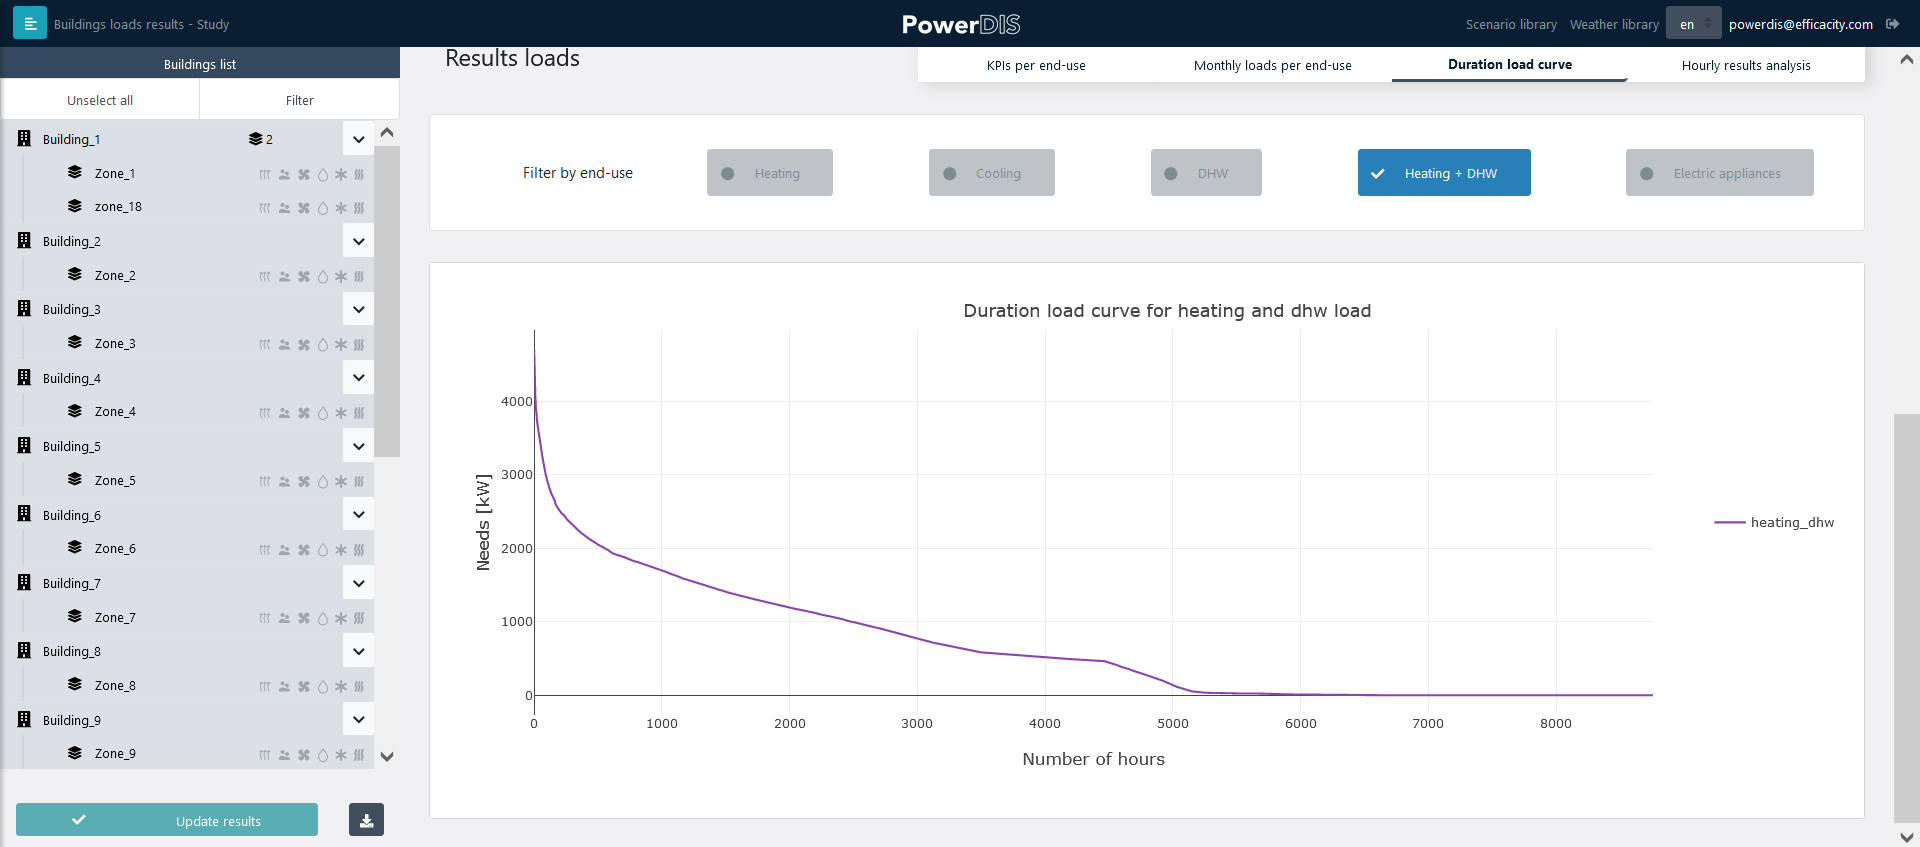
Duration load curve for the selected energy use
Hourly results analysis: this tab allows you to create hourly time series graphs by associating two variables (one per axis), as shown in the figure below. It is possible to zoom in on the graphs and to resize the axes by clicking on them. A double-click on the graph allows to reset it. These graphs can be downloaded as an image by clicking on the camera icon. The values of the x-axis and y-axis can be changed by clicking and dragging the axis. Clicking and dragging the top value extends the legend, while clicking on a value in the middle of the axis allows to make a translation of the legend.
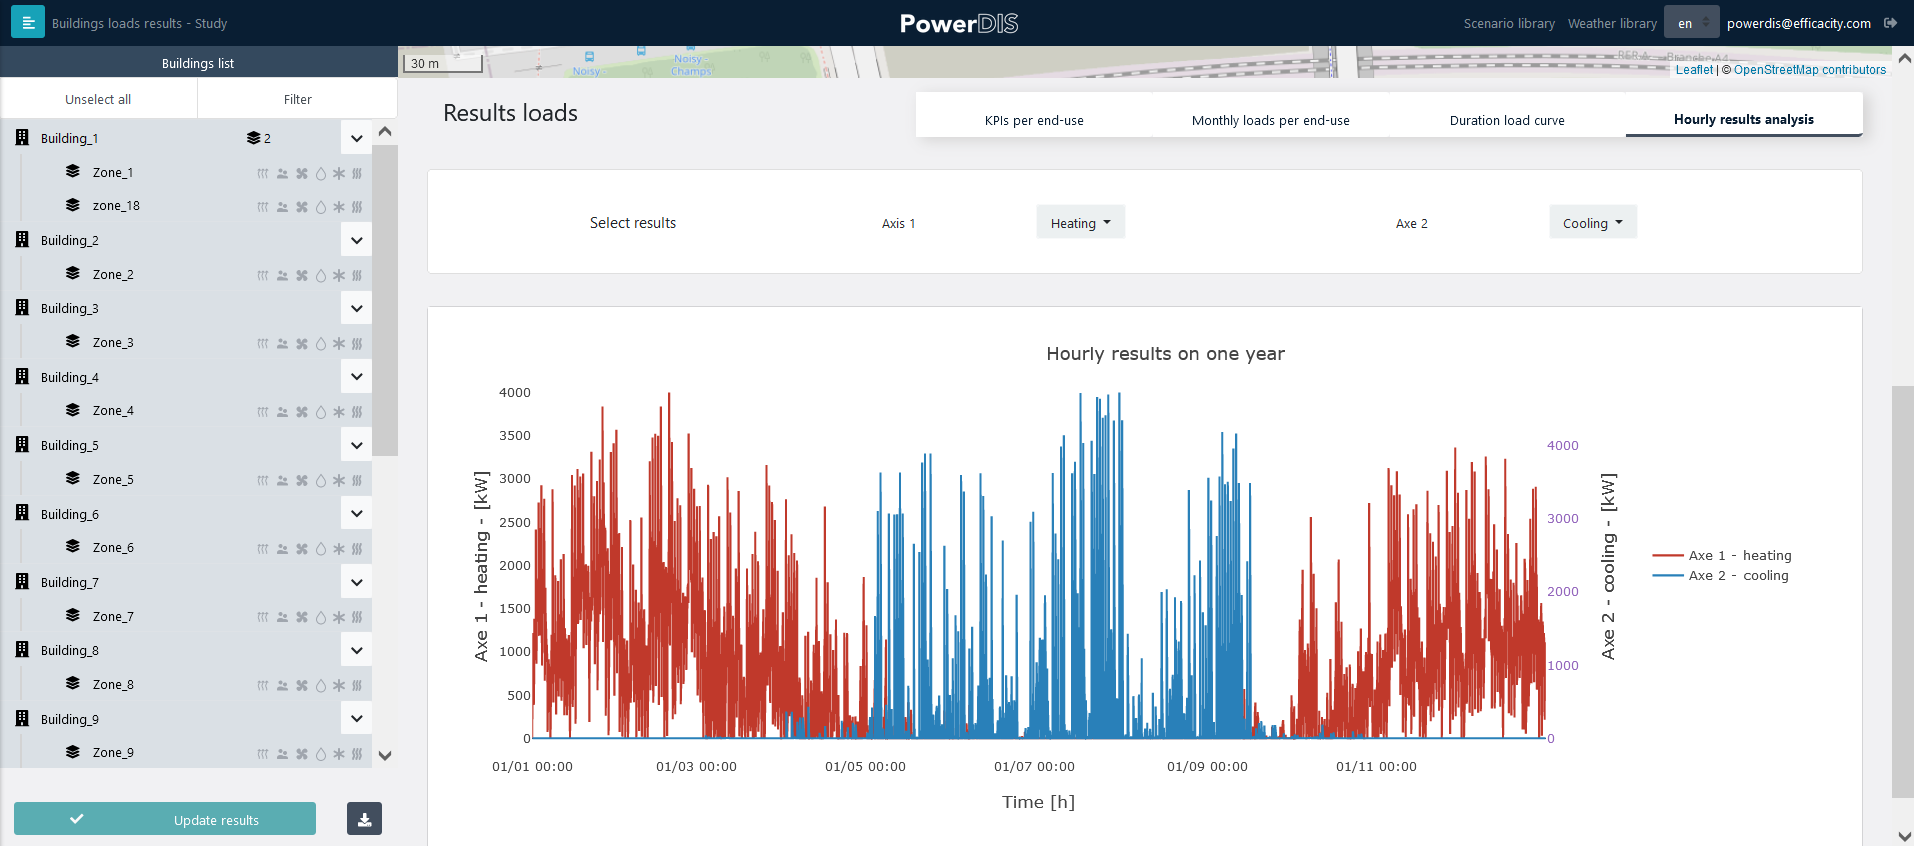
Hourly results analysis
Exporting building loads results
It is possible to export building loads results in .xlsx or .csv format by clicking on the dowload button on the bottom of the left side panel. The following options are available in the export modal window:
Results for a selection of zones or for all zones;
Results at hourly intervals;
Results at monthly intervals ;
Annual results;
Zone settings;
Export of a GeoJSON file containing the results and directly usable in a GIS software.
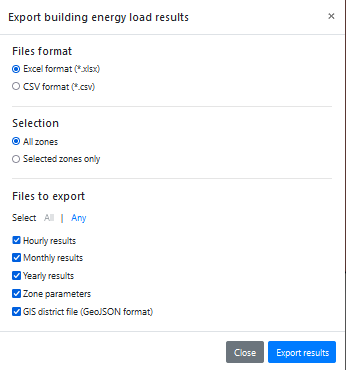
Building loads results export modal window.
Results of energy consumption simulations
Once the simulation of the energy consumptions of a study is successful, it is possible to access the result page by clicking on the study in the home page and then selecting the consumption results in the side panel.
This menu consists of two related parts.
First, the map shows the buildings and the layout of the district heating network obtained by the simulation. The buildings connected to the district heating network are marked in orange. The other buildings are shown in grey.
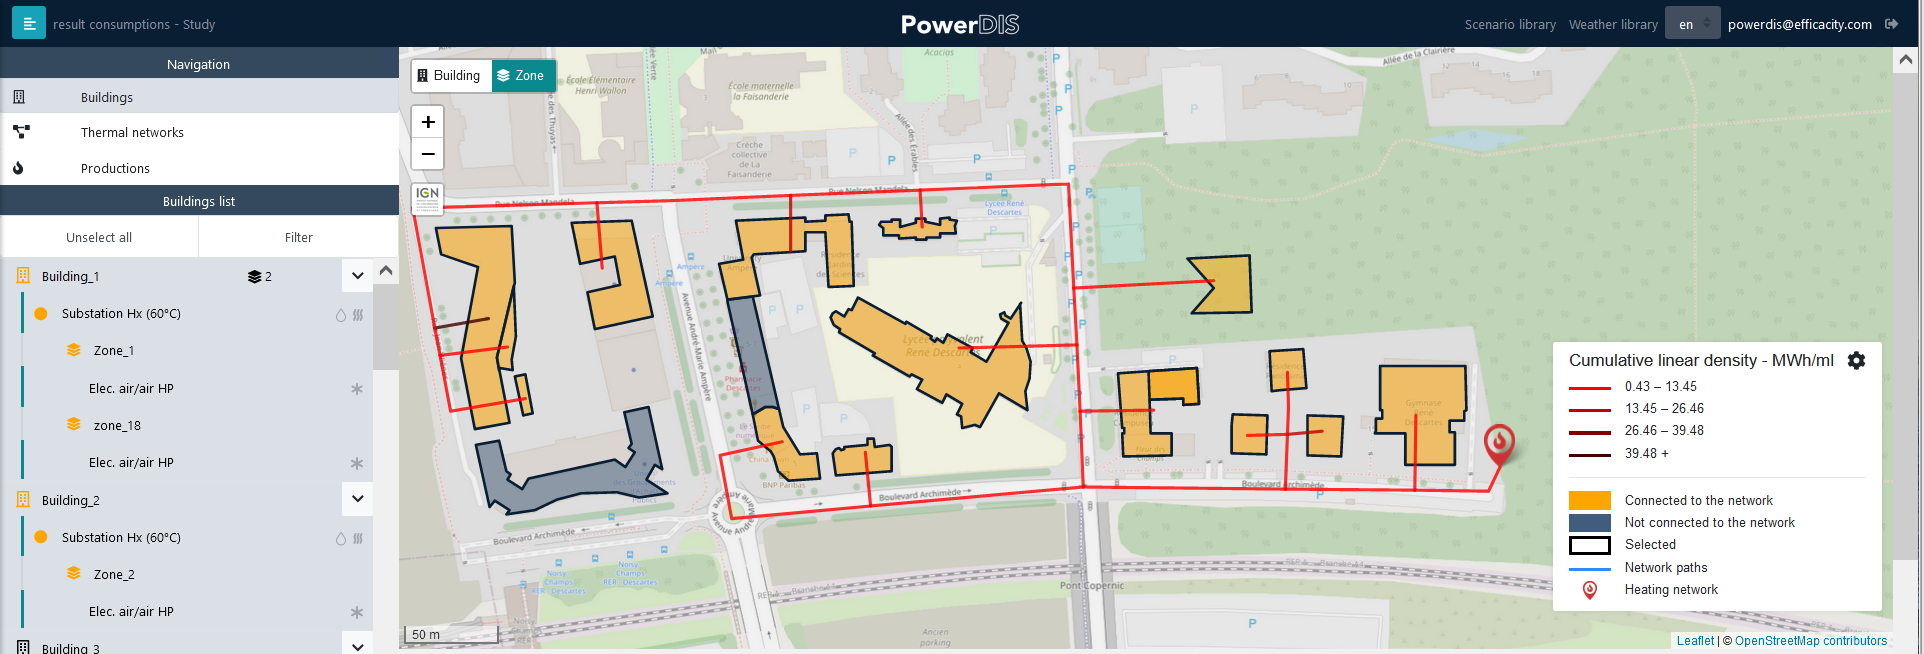
View of the consumption results map
The map legend allows you to set the color layout of the district heating network segments according to their length, diameter or linear density. The slider allows you to choose the number of quantiles (corresponding to the color shades) to be displayed.
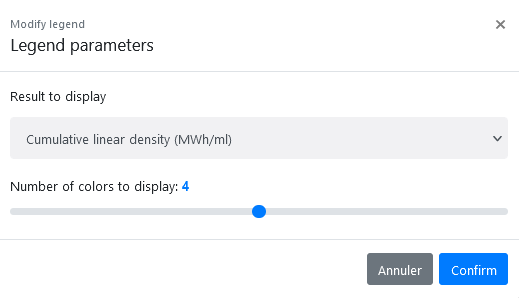
Map legend settings
When you move the mouse over a network segment, a tooltip summarizes the main information available for this segment.
The second part of the results page, below the map, presents the main consumption results of the district’s energy systems. Indicators are visible at the building, heating network or boiler room level depending on the category selected in the left navigation menu.
- The building-level results are divided into three tabs:
The tab systems summary table recalls the energy systems installed in each building
The KPI tab shows the annual inficators of consumption and performance for energy systems, distinguishing between buildings connected to a network and buildings not connected.
The tab hourly consumption shows the energy consumption by vector, superimposed or cumulated for all the buildings in the selection. Hourly system-related KPIs are also shown in other graphs.
The result graphs of the connected and unconnected buildings can be updated by selecting or deselecting the desired buildings and then clicking on the Update Results button in the left-hand menu under the list of systems.
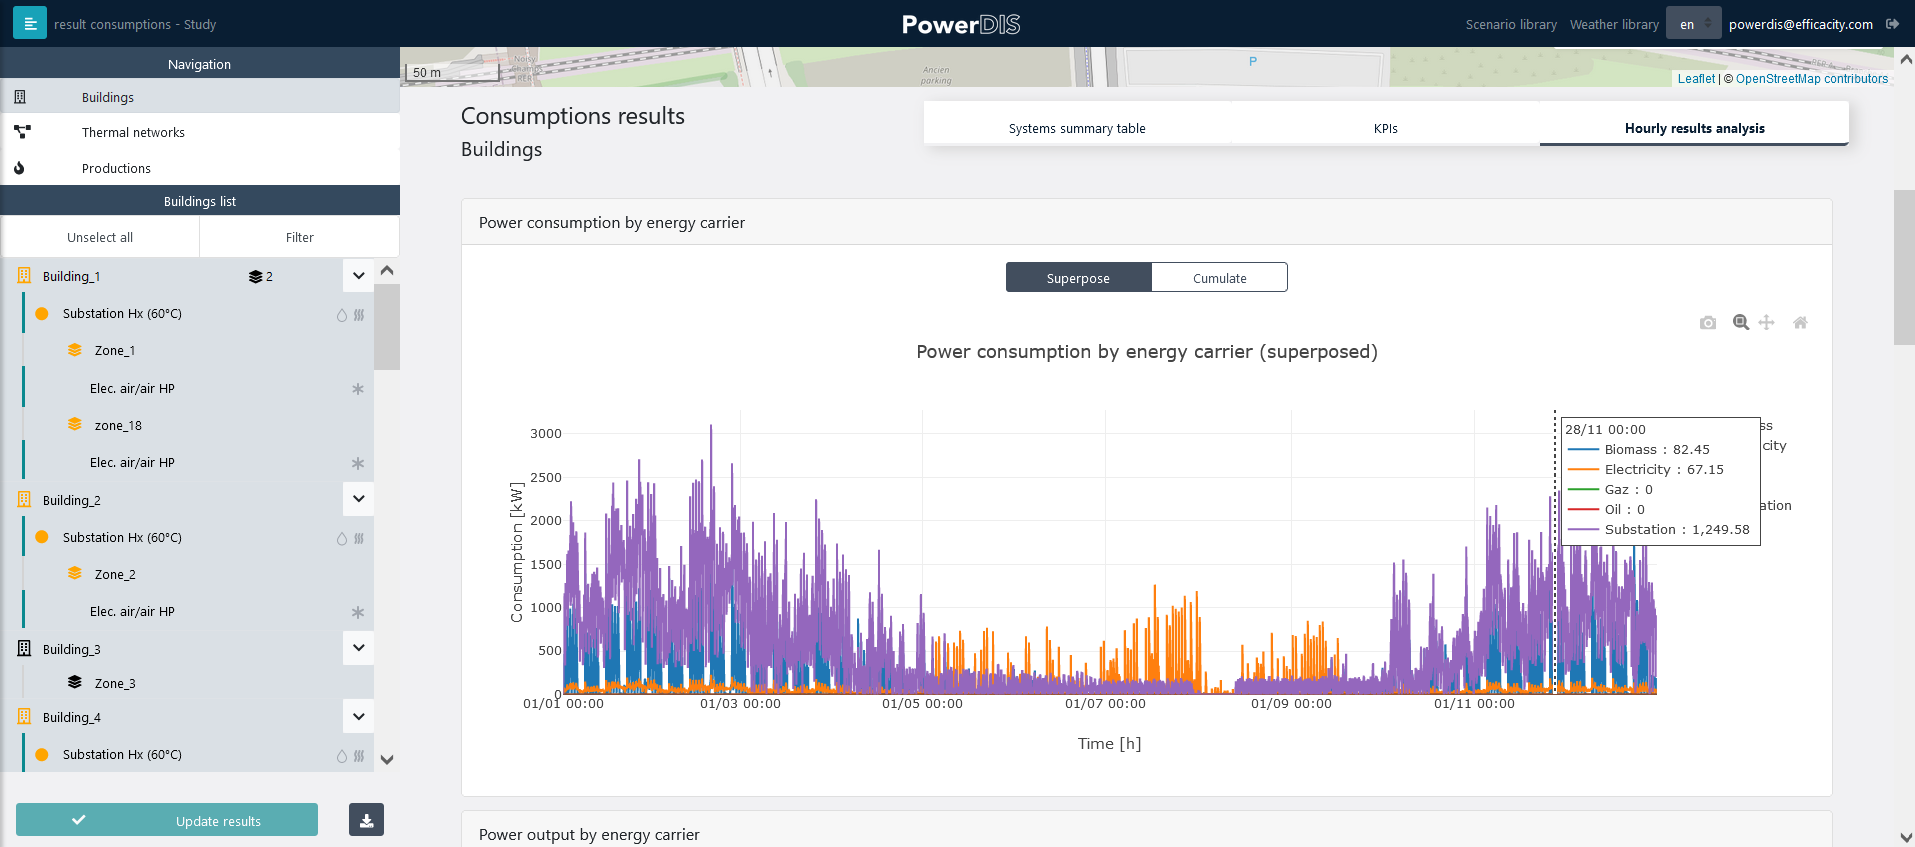
Consumption results at the system scale
- The following KPIs are provided at the district thermal network’s scale:
The diversity factor defined as the ratio between the maximum output power of the boiler room and the sum of the maximum requested power of all building substations observed during the simulation
The sizing of the boiler room (sum of the nominal power of the generators)
The maximum hourly power observed during the simulation
The network’s length
The energy density of the network defined as the ratio between the sum of the annual energies delivered to the substations and the total length of the network
The network’s renewable energy rate
The thermal losses percentage with respect to the total of the delivered thermal energy
The results of energy consumption and generation by vector are also available on an hourly basis for the district heating network.
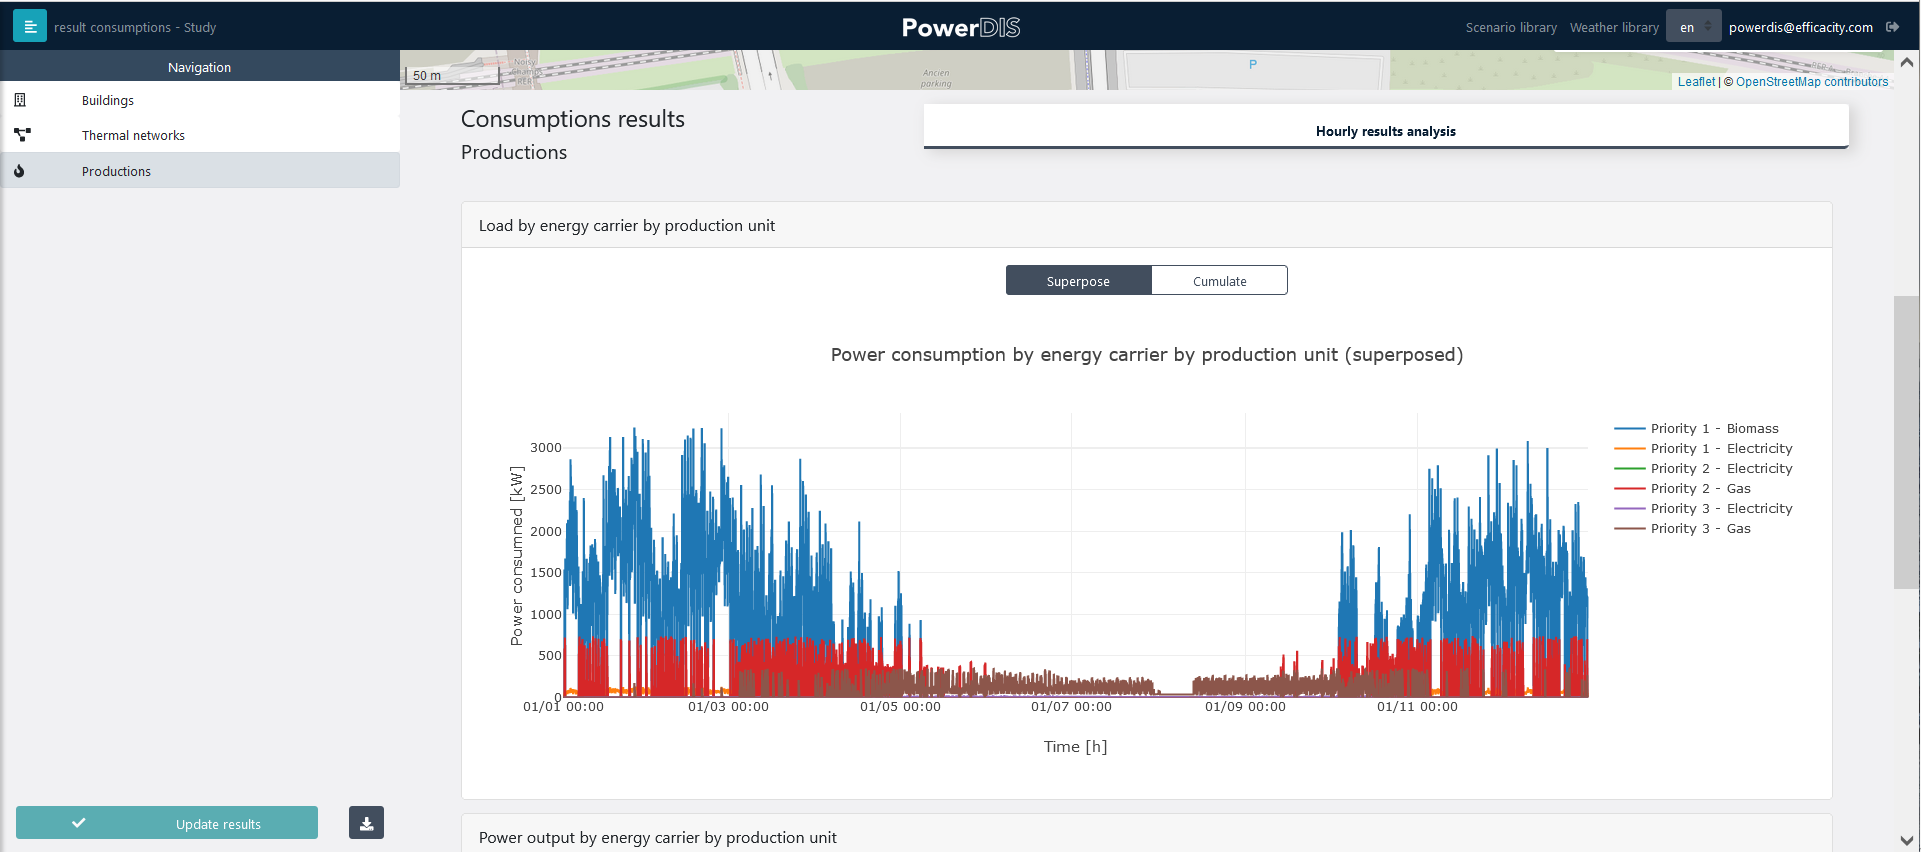
Consumption results at the boiler room level
Exporting systems consumption results
All the simulation results of a study can be exported as a compressed file containing the consumption results in csv or excel formats, by clicking on the dowload button on the bottom of the left side panel. The following options are now also available in the export modal window:
Results for a selection of systems or for all systems;
Results for systems and a GeoJSON file containing the results for each zone, directly usable in a GIS software;
Results at the network level and a GeoJSON file containing all the characteristics of the network, directly usable in a GIS software;
Results of the boiler rooms;
Zone settings.
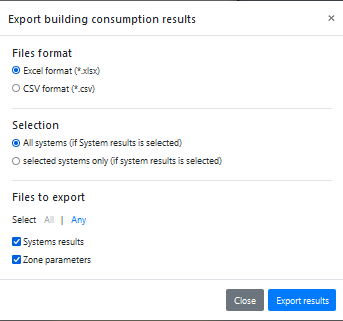
Consumptions results export modal window.
Building use scenarios library
The scenario library can be accessed by clicking on Scenario library in the horizontal banner of PowerDIS above the map.
The library allows you to view and edit the scenarios. It contains all the types of scenarios that can be assigned to a building for each use. You have the possibility to define your own scenario for your project by using the empty file template that you can fill in and re-import into your project. Your new scenario will then appear with the other scenarios in the library and you can apply it to the buildings in the project.
The scenarios are displayed in three sections:
Hourly profile by typical day: this is a list of typical days described with 24-hour values.
Distribution of daily profiles in typical weeks: these are typical weeks composed from typical days, which can be visualized in graphs by clicking on the name of the week.
Distribution of daily profiles over a typical year: this is a typical year with typical days (identified by their color) on a calendar view.
There are 2 types of scenarios. The first are in absolute values (heating and cooling setpoint temperature), The second are in relative values compared to a nominal value (flow rates of the ventilation and DHW extraction systems, internal contributions). The nominal value of the scenario and its unit are indicated at the top of the first section.
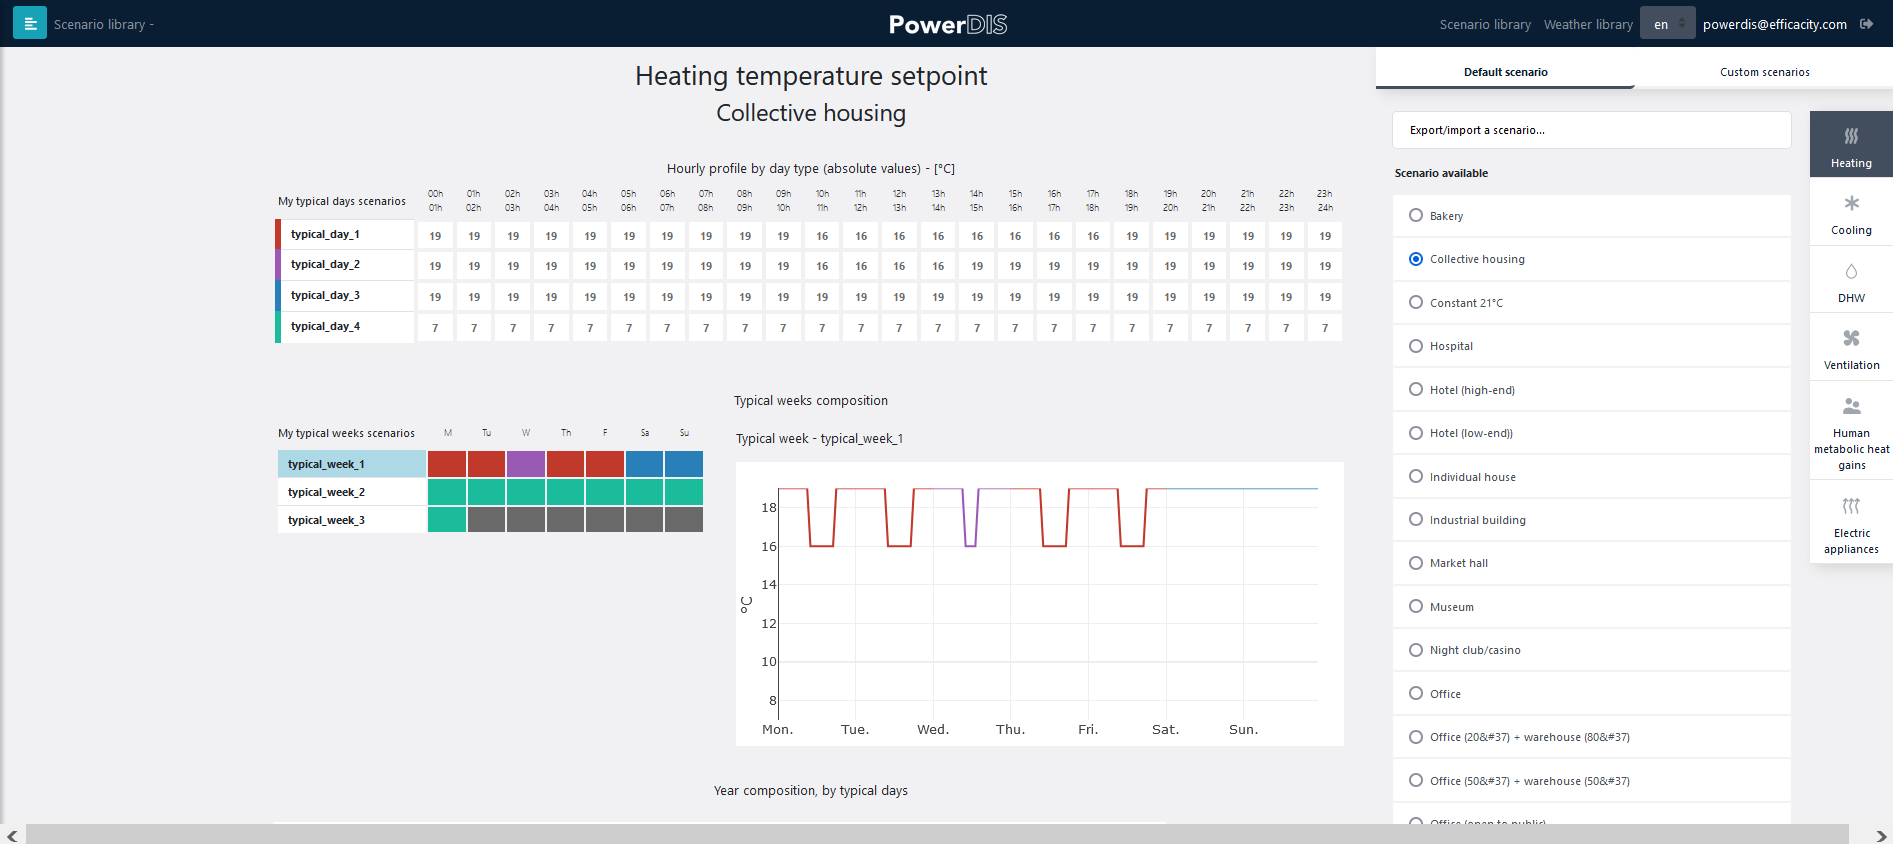
An example of a scenario: heating set point in a collective housing building
Weather library
The weather library can be accessed by the dedicated button located in the top horizontal banner of PowerDIS, next to the Scenario library. This library includes by default a series of weather files from the RT2012 (climatic zones) and files corresponding to certain French cities that you can select for your projects. You also have the possibility to import a customized weather file for your project, in case the weather of your project cannot be represented by the files available by default. Weather files can be imported in .epw format. These .epw files are available for many locations on the EnergyPlus website https://energyplus.net/weather
Weather file for specific locations can also be obtained from the meteonorm service (https://meteonorm.com/en/) which allows to download EPW files.
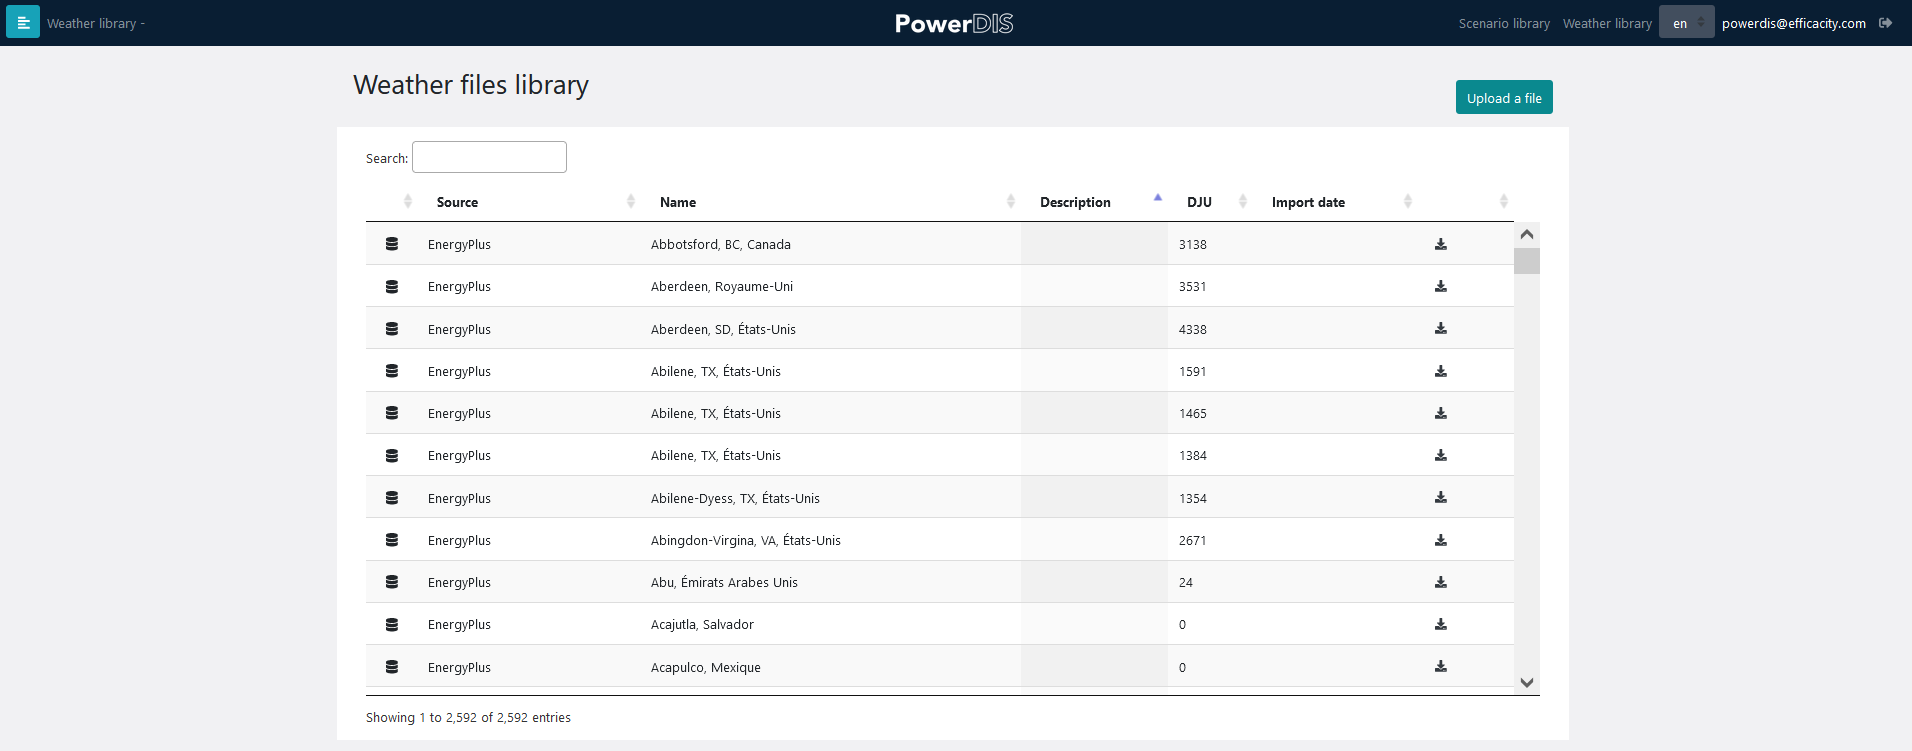
View of the weather library
Duplicate or delete a study
It is possible to duplicate or delete an existing study in the PowerDIS home page. Unlike the « Create a study » button, which systematically starts from the original parameters entered when the project was initialized, duplication allows you to start from from an existing study entry, including the modifications made by the user. This feature is useful for quickly changing one or more parameters in one or more buildings while keeping the rest of the parameters the same and thus simulate and compare results between studies.

Study toolbar
Change the map background
PowerDIS uses by default the background map tiles provided by IGN. However, it is possible to use an Open Street Map background by clicking on the map button at the top left of the map.
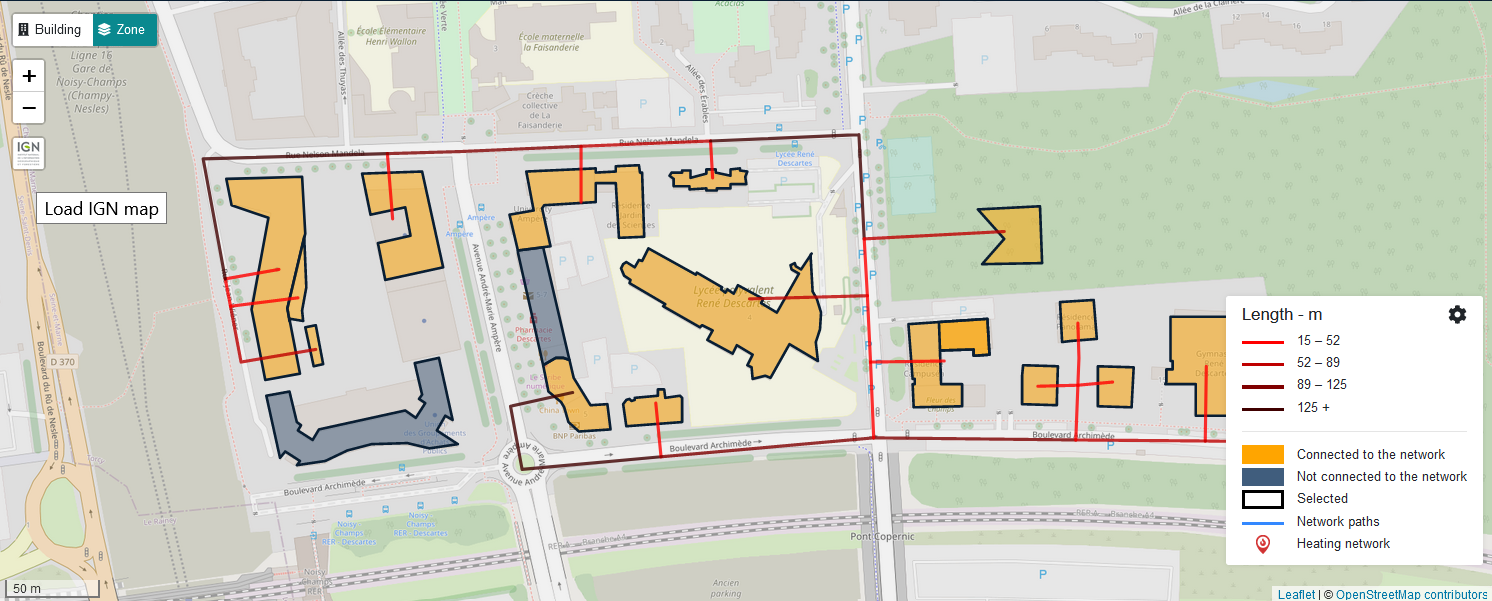
Button for changing the map background and illustration of the two available maps


